{"title":"Frequency and Trends of Pre-Pandemic Surge Periods in U.S. Emergency Departments, 2006-2019.","authors":"George L Anesi, Ruiying Aria Xiong, M Kit Delgado","doi":"10.1097/CCE.0000000000000954","DOIUrl":null,"url":null,"abstract":"<p><strong>Objectives: </strong>To quantify the frequency, outside of the pandemic setting, with which individual healthcare facilities faced surge periods due to severe increases in demand for emergency department (ED) care.</p><p><strong>Design: </strong>Retrospective cohort study.</p><p><strong>Setting: </strong>U.S. EDs.</p><p><strong>Patients: </strong>All ED encounters in the all-payer, nationally representative Nationwide Emergency Department Sample from the Healthcare Cost and Utilization Project, 2006-2019.</p><p><strong>Interventions: </strong>None.</p><p><strong>Measurements and main results: </strong>Frequency of surge periods defined as ED months in which an individual facility ED saw a greater than 50% increase in ED visits per month above facility-/calendar month-specific medians. During 2006-2019, 3,317 U.S. EDs reported 354,534,229 ED visits across 142,035 ED months. Fifty-seven thousand four hundred ninety-five ED months (40.5%) during the study period had a 0% to 50% increase in ED visits that month above facility-specific medians and 1,952 ED months (1.4%) qualified as surge periods and had a greater than 50% increase in ED visits that month above facility-specific medians. These surge months were experienced by 397 unique facility EDs (12.0%). Compared with 2006, the most proximal pre-pandemic period of 2016-2019 had a notably elevated likelihood of ED-month surge periods (odds ratios [ORs], 2.36-2.84; all <i>p</i> < 0.0005). Compared with the calendar month of January, the winter ED months in December through March have similar likelihood of an ED-month qualifying as a surge period (ORs, 0.84-1.03; all <i>p</i> > 0.05), while the nonwinter ED months in April through November have a lower likelihood of an ED-month qualifying as a surge period (ORs, 0.65-0.81; all <i>p</i> < 0.05).</p><p><strong>Conclusions: </strong>Understanding the frequency of surges in demand for ED care-which appear to have increased in frequency even before the COVID-19 pandemic and are concentrated in winter months-is necessary to better understand the burden of potential and realized acute surge events and to inform cost-effectiveness preparedness strategies.</p>","PeriodicalId":10759,"journal":{"name":"Critical Care Explorations","volume":"5 8","pages":"e0954"},"PeriodicalIF":0.0000,"publicationDate":"2023-08-21","publicationTypes":"Journal Article","fieldsOfStudy":null,"isOpenAccess":false,"openAccessPdf":"https://ftp.ncbi.nlm.nih.gov/pub/pmc/oa_pdf/25/d4/cc9-5-e0954.PMC10443743.pdf","citationCount":"0","resultStr":null,"platform":"Semanticscholar","paperid":null,"PeriodicalName":"Critical Care Explorations","FirstCategoryId":"1085","ListUrlMain":"https://doi.org/10.1097/CCE.0000000000000954","RegionNum":0,"RegionCategory":null,"ArticlePicture":[],"TitleCN":null,"AbstractTextCN":null,"PMCID":null,"EPubDate":"2023/8/1 0:00:00","PubModel":"eCollection","JCR":"","JCRName":"","Score":null,"Total":0}
引用次数: 0
Abstract
Objectives: To quantify the frequency, outside of the pandemic setting, with which individual healthcare facilities faced surge periods due to severe increases in demand for emergency department (ED) care.
Design: Retrospective cohort study.
Setting: U.S. EDs.
Patients: All ED encounters in the all-payer, nationally representative Nationwide Emergency Department Sample from the Healthcare Cost and Utilization Project, 2006-2019.
Interventions: None.
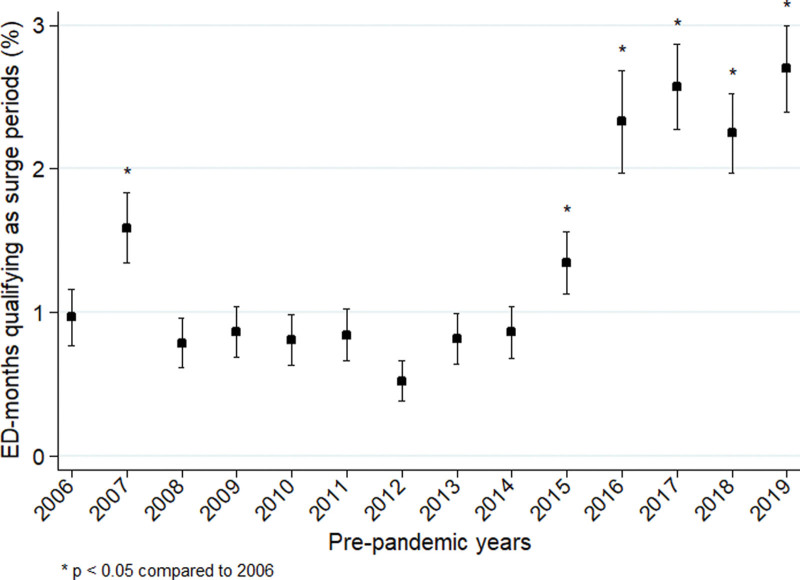
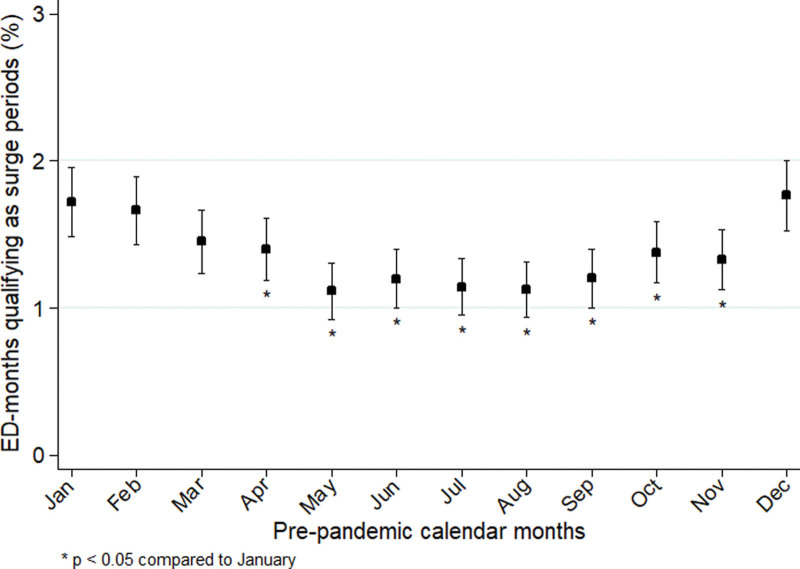
Measurements and main results: Frequency of surge periods defined as ED months in which an individual facility ED saw a greater than 50% increase in ED visits per month above facility-/calendar month-specific medians. During 2006-2019, 3,317 U.S. EDs reported 354,534,229 ED visits across 142,035 ED months. Fifty-seven thousand four hundred ninety-five ED months (40.5%) during the study period had a 0% to 50% increase in ED visits that month above facility-specific medians and 1,952 ED months (1.4%) qualified as surge periods and had a greater than 50% increase in ED visits that month above facility-specific medians. These surge months were experienced by 397 unique facility EDs (12.0%). Compared with 2006, the most proximal pre-pandemic period of 2016-2019 had a notably elevated likelihood of ED-month surge periods (odds ratios [ORs], 2.36-2.84; all p < 0.0005). Compared with the calendar month of January, the winter ED months in December through March have similar likelihood of an ED-month qualifying as a surge period (ORs, 0.84-1.03; all p > 0.05), while the nonwinter ED months in April through November have a lower likelihood of an ED-month qualifying as a surge period (ORs, 0.65-0.81; all p < 0.05).
Conclusions: Understanding the frequency of surges in demand for ED care-which appear to have increased in frequency even before the COVID-19 pandemic and are concentrated in winter months-is necessary to better understand the burden of potential and realized acute surge events and to inform cost-effectiveness preparedness strategies.


 分享
分享

 求助内容:
求助内容: 应助结果提醒方式:
 扫码关注我们
