{"title":"Development of Magnetic Resonance Imaging (MRI) Phantom With Arbitrary T1 Value Using Dextrin Hydrate","authors":"Yusuke Sato, Daiki Ito, Norio Hayashi, Kouichi Ujita, Takayuki Suto, Haruyuki Watanabe, Yoshito Tsushima","doi":"10.1007/s00723-024-01655-x","DOIUrl":null,"url":null,"abstract":"<div><p>To formulate the relationship between the dextrin hydrate concentration and T1 relaxation rate and create a magnetic resonance imaging (MRI) phantom with an arbitrary T1 value. Dextrin solution with nine different concentrations was prepared by dissolving 0–20 g (2.5 g increments) of dextrin in 25 g of purified water. The T1 values of the phantoms were measured using a 1.5 T MR scanner, and the relationship between the R1 value and dextrin concentration was regressed using linear and quadratic equations. Phantoms with concentrations adjusted to T1 values of 500, 1000, and 1500 ms were created from each regression equation, and the errors between the measured T1 and target values were evaluated. In addition, the temporal changes in the T1 and T2 values of the phantoms were also evaluated. The T1 and T2 values ranged from 367.4 ± 14.1 to 2577.6 ± 76.5 ms and 20.0 ± 0.9 to 1805.3 ± 8.3 ms, respectively. The linear and quadratic regression equations were <span>\\(y=2.9631x+0.2043\\)</span> and <span>\\(y=1.8295{x}^{2}+1.4995x+0.37\\)</span>, with coefficients of determination of 0.9763 and 0.9954, respectively. The maximum errors were 12.3% and 2.1% for the linear and quadratic equations, respectively. The T1 value was maintained at a fluctuation rate of approximately 10% during the first 4 weeks. The T2 value decreased by approximately 20% after 4 weeks. MRI phantoms with arbitrary T1 values in the range of 500–1500 ms with an error within 2.1% can be created using dextrin, which can be used as human tissue-equivalent MRI phantoms for T1 of the grey or white matter of the brain, liver, pancreas, spleen, and prostate.</p></div>","PeriodicalId":469,"journal":{"name":"Applied Magnetic Resonance","volume":"55 5","pages":"497 - 507"},"PeriodicalIF":1.1000,"publicationDate":"2024-04-21","publicationTypes":"Journal Article","fieldsOfStudy":null,"isOpenAccess":false,"openAccessPdf":"","citationCount":"0","resultStr":null,"platform":"Semanticscholar","paperid":null,"PeriodicalName":"Applied Magnetic Resonance","FirstCategoryId":"101","ListUrlMain":"https://link.springer.com/article/10.1007/s00723-024-01655-x","RegionNum":4,"RegionCategory":"物理与天体物理","ArticlePicture":[],"TitleCN":null,"AbstractTextCN":null,"PMCID":null,"EPubDate":"","PubModel":"","JCR":"Q4","JCRName":"PHYSICS, ATOMIC, MOLECULAR & CHEMICAL","Score":null,"Total":0}
引用次数: 0
Abstract
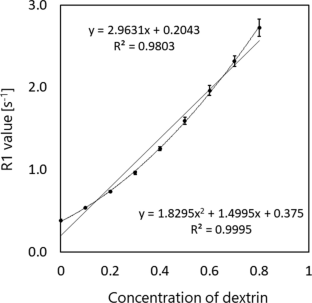
To formulate the relationship between the dextrin hydrate concentration and T1 relaxation rate and create a magnetic resonance imaging (MRI) phantom with an arbitrary T1 value. Dextrin solution with nine different concentrations was prepared by dissolving 0–20 g (2.5 g increments) of dextrin in 25 g of purified water. The T1 values of the phantoms were measured using a 1.5 T MR scanner, and the relationship between the R1 value and dextrin concentration was regressed using linear and quadratic equations. Phantoms with concentrations adjusted to T1 values of 500, 1000, and 1500 ms were created from each regression equation, and the errors between the measured T1 and target values were evaluated. In addition, the temporal changes in the T1 and T2 values of the phantoms were also evaluated. The T1 and T2 values ranged from 367.4 ± 14.1 to 2577.6 ± 76.5 ms and 20.0 ± 0.9 to 1805.3 ± 8.3 ms, respectively. The linear and quadratic regression equations were \(y=2.9631x+0.2043\) and \(y=1.8295{x}^{2}+1.4995x+0.37\), with coefficients of determination of 0.9763 and 0.9954, respectively. The maximum errors were 12.3% and 2.1% for the linear and quadratic equations, respectively. The T1 value was maintained at a fluctuation rate of approximately 10% during the first 4 weeks. The T2 value decreased by approximately 20% after 4 weeks. MRI phantoms with arbitrary T1 values in the range of 500–1500 ms with an error within 2.1% can be created using dextrin, which can be used as human tissue-equivalent MRI phantoms for T1 of the grey or white matter of the brain, liver, pancreas, spleen, and prostate.
期刊介绍:
Applied Magnetic Resonance provides an international forum for the application of magnetic resonance in physics, chemistry, biology, medicine, geochemistry, ecology, engineering, and related fields.
The contents include articles with a strong emphasis on new applications, and on new experimental methods. Additional features include book reviews and Letters to the Editor.


 分享
分享
 求助内容:
求助内容: 应助结果提醒方式:
 扫码关注我们
