Elena Farahbakhsh Touli, Hoang Nguyen, Olha Bodnar
{"title":"Monitoring the Dynamic Networks of Stock Returns with an Application to the Swedish Stock Market","authors":"Elena Farahbakhsh Touli, Hoang Nguyen, Olha Bodnar","doi":"10.1007/s10614-024-10616-2","DOIUrl":null,"url":null,"abstract":"<p>In this paper, two approaches for measuring the distance between stock returns and the network connectedness are presented that are based on the Pearson correlation coefficient dissimilarity and the generalized variance decomposition dissimilarity. Using these two procedures, the center of the network is determined. Also, hierarchical clustering methods are used to divide the dense networks into sparse trees, which provide us with information about how the companies of a financial market are related to each other. We implement the derived theoretical results to study the dynamic connectedness between the companies in the Swedish capital market by considering 28 companies included in the determination of the market index OMX30. The network structure of the market is constructed using different methods to determine the distance between the companies. We use hierarchical clustering methods to find the relation among the companies in each window. Next, we obtain a one-dimensional time series of the distances between the clustering trees that reflect the changes in the relationship between the companies in the market over time. The method from statistical process control, namely the Shewhart control chart, is applied to those time series to detect abnormal changes in the financial market.</p>","PeriodicalId":50647,"journal":{"name":"Computational Economics","volume":"63 1","pages":""},"PeriodicalIF":2.2000,"publicationDate":"2024-05-08","publicationTypes":"Journal Article","fieldsOfStudy":null,"isOpenAccess":false,"openAccessPdf":"","citationCount":"0","resultStr":null,"platform":"Semanticscholar","paperid":null,"PeriodicalName":"Computational Economics","FirstCategoryId":"96","ListUrlMain":"https://doi.org/10.1007/s10614-024-10616-2","RegionNum":4,"RegionCategory":"经济学","ArticlePicture":[],"TitleCN":null,"AbstractTextCN":null,"PMCID":null,"EPubDate":"","PubModel":"","JCR":"Q2","JCRName":"ECONOMICS","Score":null,"Total":0}
引用次数: 0
Abstract
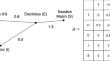
In this paper, two approaches for measuring the distance between stock returns and the network connectedness are presented that are based on the Pearson correlation coefficient dissimilarity and the generalized variance decomposition dissimilarity. Using these two procedures, the center of the network is determined. Also, hierarchical clustering methods are used to divide the dense networks into sparse trees, which provide us with information about how the companies of a financial market are related to each other. We implement the derived theoretical results to study the dynamic connectedness between the companies in the Swedish capital market by considering 28 companies included in the determination of the market index OMX30. The network structure of the market is constructed using different methods to determine the distance between the companies. We use hierarchical clustering methods to find the relation among the companies in each window. Next, we obtain a one-dimensional time series of the distances between the clustering trees that reflect the changes in the relationship between the companies in the market over time. The method from statistical process control, namely the Shewhart control chart, is applied to those time series to detect abnormal changes in the financial market.
期刊介绍:
Computational Economics, the official journal of the Society for Computational Economics, presents new research in a rapidly growing multidisciplinary field that uses advanced computing capabilities to understand and solve complex problems from all branches in economics. The topics of Computational Economics include computational methods in econometrics like filtering, bayesian and non-parametric approaches, markov processes and monte carlo simulation; agent based methods, machine learning, evolutionary algorithms, (neural) network modeling; computational aspects of dynamic systems, optimization, optimal control, games, equilibrium modeling; hardware and software developments, modeling languages, interfaces, symbolic processing, distributed and parallel processing


 分享
分享
 求助内容:
求助内容: 应助结果提醒方式:
 扫码关注我们
