{"title":"Quantifying the drivers and heterogeneity of global total precipitable water†","authors":"S. Maishal","doi":"10.1039/D4EA00030G","DOIUrl":null,"url":null,"abstract":"<p >Total precipitable water (TPW) is a key player in the global water cycle, shaping our climate and impacting extreme weather phenomena such as tropical storms and monsoons. Its presence, varying across regions and seasons, is the highest in warm oceanic regions, particularly in the tropics and subtropics, while polar regions see the least. Multiple satellite observations provide compelling evidence of a positive and statistically significant trend in TPW, indicating a notable increase at a rate of 0.037 kg per m<small><sup>−3</sup></small> per year. Ocean temperatures vary regionally; the North Atlantic Ocean (NAO) warms at 0.02–0.03 °C per year and South Atlantic Ocean (SAO) warms slower at 0.015–0.020 °C per year. The Equatorial and Northeastern Pacific warm at 0.038–0.040 °C per year. The Indian Ocean (IO) warms the fastest at 0.1–0.18 °C per year, and Southern Ocean (SO) and Atlantic Ocean (AO) show mixed trends, including cooling. The intricate relationship between natural climate indices and the global TPW received strong positive feedback from the Pacific decadal oscillation (PDO) and oceanic Niño index (ONI), indicating their profound impact on TPW. The Western Pacific index (WP) exhibits a direct and strong positive feedback loop and a strong relationship of PDO and ONI with TPW. Increasing the <em>α</em> level enhances connections, notably between the multivariate ENSO index (MEI) and dipole mode index (DMI). Interactions between these indices and TPW unveil interconnected climatic processes affecting atmospheric moisture. Recognizing these dynamics is crucial for accurate climate predictions, given the reinforcement of positive feedback loops.</p>","PeriodicalId":72942,"journal":{"name":"Environmental science: atmospheres","volume":" 7","pages":" 767-781"},"PeriodicalIF":3.5000,"publicationDate":"2024-06-10","publicationTypes":"Journal Article","fieldsOfStudy":null,"isOpenAccess":false,"openAccessPdf":"https://pubs.rsc.org/en/content/articlepdf/2024/ea/d4ea00030g?page=search","citationCount":"0","resultStr":null,"platform":"Semanticscholar","paperid":null,"PeriodicalName":"Environmental science: atmospheres","FirstCategoryId":"1085","ListUrlMain":"https://pubs.rsc.org/en/content/articlelanding/2024/ea/d4ea00030g","RegionNum":0,"RegionCategory":null,"ArticlePicture":[],"TitleCN":null,"AbstractTextCN":null,"PMCID":null,"EPubDate":"","PubModel":"","JCR":"Q3","JCRName":"ENVIRONMENTAL SCIENCES","Score":null,"Total":0}
引用次数: 0
Abstract
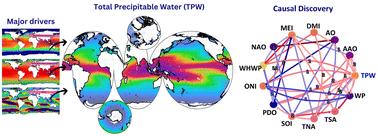
Total precipitable water (TPW) is a key player in the global water cycle, shaping our climate and impacting extreme weather phenomena such as tropical storms and monsoons. Its presence, varying across regions and seasons, is the highest in warm oceanic regions, particularly in the tropics and subtropics, while polar regions see the least. Multiple satellite observations provide compelling evidence of a positive and statistically significant trend in TPW, indicating a notable increase at a rate of 0.037 kg per m−3 per year. Ocean temperatures vary regionally; the North Atlantic Ocean (NAO) warms at 0.02–0.03 °C per year and South Atlantic Ocean (SAO) warms slower at 0.015–0.020 °C per year. The Equatorial and Northeastern Pacific warm at 0.038–0.040 °C per year. The Indian Ocean (IO) warms the fastest at 0.1–0.18 °C per year, and Southern Ocean (SO) and Atlantic Ocean (AO) show mixed trends, including cooling. The intricate relationship between natural climate indices and the global TPW received strong positive feedback from the Pacific decadal oscillation (PDO) and oceanic Niño index (ONI), indicating their profound impact on TPW. The Western Pacific index (WP) exhibits a direct and strong positive feedback loop and a strong relationship of PDO and ONI with TPW. Increasing the α level enhances connections, notably between the multivariate ENSO index (MEI) and dipole mode index (DMI). Interactions between these indices and TPW unveil interconnected climatic processes affecting atmospheric moisture. Recognizing these dynamics is crucial for accurate climate predictions, given the reinforcement of positive feedback loops.


 分享
分享

 求助内容:
求助内容: 应助结果提醒方式:
 扫码关注我们
