Vahid Kiarad MD, MPH , Feroze Mahmood MD, FASE , Mona Hedayat MD , Rayaan Yunus MPH , Alina Nicoara MD , David Liu MD , Louis Chu MD , Vankatachalam Senthilnathan MD , Masashi Kai MD , Kamal Khabbaz MD
{"title":"Intraoperative right ventricular end-systolic pressure–volume loop analysis in patients undergoing cardiac surgery: A proof-of-concept methodology","authors":"Vahid Kiarad MD, MPH , Feroze Mahmood MD, FASE , Mona Hedayat MD , Rayaan Yunus MPH , Alina Nicoara MD , David Liu MD , Louis Chu MD , Vankatachalam Senthilnathan MD , Masashi Kai MD , Kamal Khabbaz MD","doi":"10.1016/j.xjon.2024.09.020","DOIUrl":null,"url":null,"abstract":"<div><h3>Background</h3><div>Perioperative right ventricular (RV) dysfunction is associated with increased morbidity and mortality in cardiac surgery patients. This study aimed to demonstrate proof of concept in generating intraoperative RV pressure–volume (PV) loops and conducting an end-systolic PV relationship (ESPVR) analysis using data obtained from routinely used intraoperative monitors.</div></div><div><h3>Methods</h3><div>Adult patients undergoing cardiac surgery with the placement of a pulmonary artery catheter (PAC) between May 2023 and March 2024 were included prospectively. The PV loops were generated using 3-dimensional echocardiographic RV volume data and continuous RV pressure data obtained from a PAC. The volume–time and pressure–time curves were digitized using the semiautomatic WebPlotDigitizer program and synchronized to reconstruct an RV PV loop and analyze ESPVR using the previously validated single-beat method.</div></div><div><h3>Results</h3><div>Intraoperative RV PV loops were generated for 25 patients, including 17 patients with preserved RV systolic function (group 1) and 8 patients with reduced systolic function (group 2). Mean E<sub>es</sub>, E<sub>a</sub>, and E<sub>es</sub>/E<sub>a</sub> ratio were 0.63 ± 0.25 mm Hg/mL, 0.60 ± 0.23 mm Hg/mL, and 1.0 8 ± 0.31 mm Hg/mL, respectively, by the P<sub>max</sub> method and 0.56 ± 0.32 mm Hg/mL, 0.60 ± 0.23 mm Hg/mL, and 0.91 ± 0.21 mm Hg/mL, respectively, by the V<sub>0</sub> method. Group 1 had a significantly higher E<sub>es</sub> compared to group 2 regardless of the calculation method and a larger E<sub>es</sub>/E<sub>a</sub> ratio calculated by the V<sub>0</sub> method.</div></div><div><h3>Conclusions</h3><div>It is clinically feasible to derive RV PV loops from routine hemodynamic and echocardiographic data. With further validation and technological support, this can be a potential real-time intraoperative RV function monitoring tool.</div></div>","PeriodicalId":74032,"journal":{"name":"JTCVS open","volume":"22 ","pages":"Pages 225-234"},"PeriodicalIF":1.9000,"publicationDate":"2024-12-01","publicationTypes":"Journal Article","fieldsOfStudy":null,"isOpenAccess":false,"openAccessPdf":"https://www.ncbi.nlm.nih.gov/pmc/articles/PMC11704560/pdf/","citationCount":"0","resultStr":null,"platform":"Semanticscholar","paperid":null,"PeriodicalName":"JTCVS open","FirstCategoryId":"1085","ListUrlMain":"https://www.sciencedirect.com/science/article/pii/S2666273624002687","RegionNum":0,"RegionCategory":null,"ArticlePicture":[],"TitleCN":null,"AbstractTextCN":null,"PMCID":null,"EPubDate":"","PubModel":"","JCR":"","JCRName":"","Score":null,"Total":0}
引用次数: 0
Abstract
Background
Perioperative right ventricular (RV) dysfunction is associated with increased morbidity and mortality in cardiac surgery patients. This study aimed to demonstrate proof of concept in generating intraoperative RV pressure–volume (PV) loops and conducting an end-systolic PV relationship (ESPVR) analysis using data obtained from routinely used intraoperative monitors.
Methods
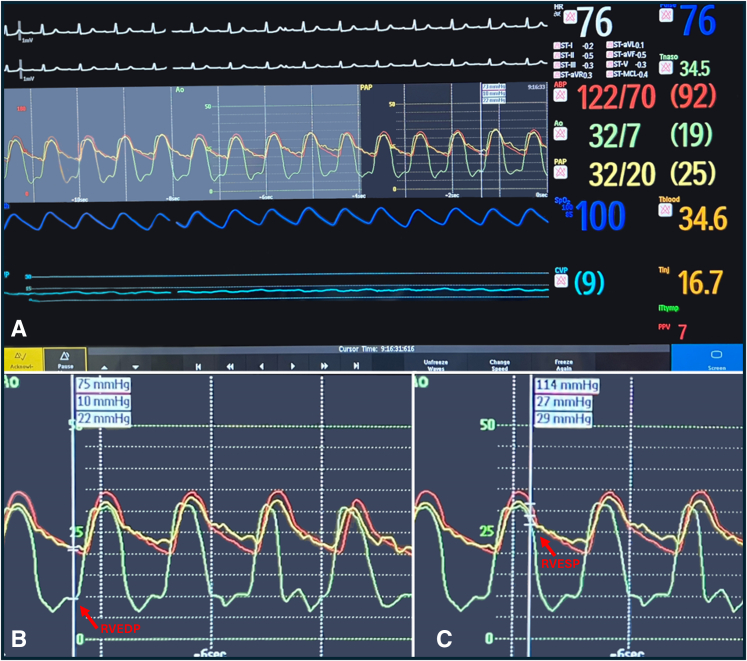
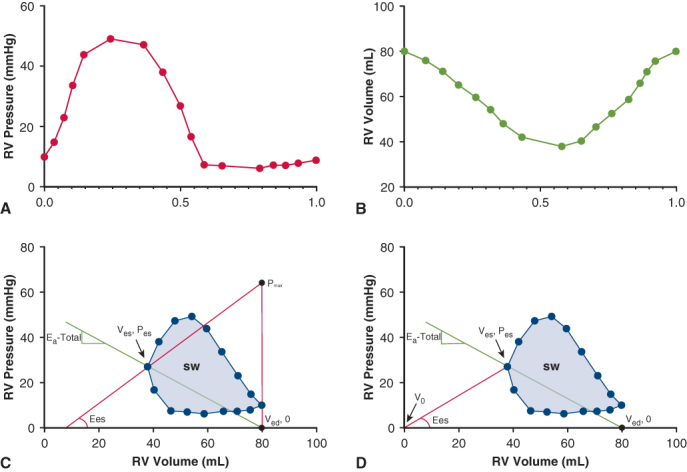
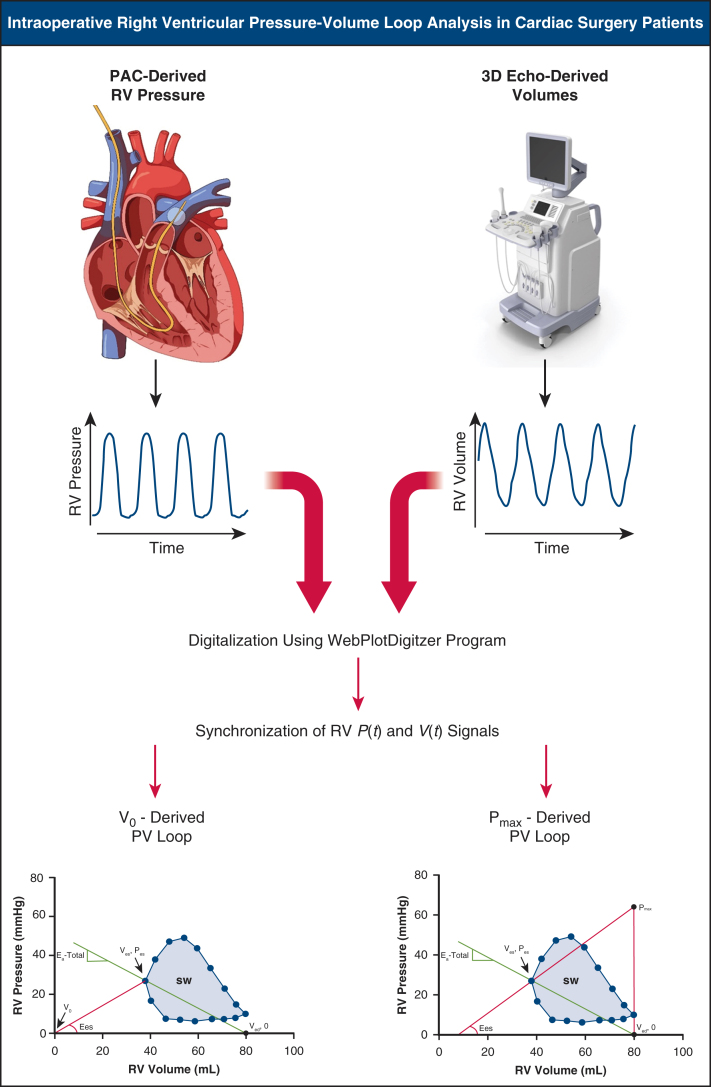
Adult patients undergoing cardiac surgery with the placement of a pulmonary artery catheter (PAC) between May 2023 and March 2024 were included prospectively. The PV loops were generated using 3-dimensional echocardiographic RV volume data and continuous RV pressure data obtained from a PAC. The volume–time and pressure–time curves were digitized using the semiautomatic WebPlotDigitizer program and synchronized to reconstruct an RV PV loop and analyze ESPVR using the previously validated single-beat method.
Results
Intraoperative RV PV loops were generated for 25 patients, including 17 patients with preserved RV systolic function (group 1) and 8 patients with reduced systolic function (group 2). Mean Ees, Ea, and Ees/Ea ratio were 0.63 ± 0.25 mm Hg/mL, 0.60 ± 0.23 mm Hg/mL, and 1.0 8 ± 0.31 mm Hg/mL, respectively, by the Pmax method and 0.56 ± 0.32 mm Hg/mL, 0.60 ± 0.23 mm Hg/mL, and 0.91 ± 0.21 mm Hg/mL, respectively, by the V0 method. Group 1 had a significantly higher Ees compared to group 2 regardless of the calculation method and a larger Ees/Ea ratio calculated by the V0 method.
Conclusions
It is clinically feasible to derive RV PV loops from routine hemodynamic and echocardiographic data. With further validation and technological support, this can be a potential real-time intraoperative RV function monitoring tool.
背景:围手术期右心室功能障碍与心脏手术患者发病率和死亡率增加有关。本研究旨在验证术中心室压力-容积(PV)循环产生的概念,并利用术中常规使用的监护仪获得的数据进行收缩期末期PV关系(ESPVR)分析。方法:前瞻性纳入2023年5月至2024年3月期间接受心脏手术并放置肺动脉导管(PAC)的成年患者。利用三维超声心动图右心室容积数据和PAC获得的连续右心室压力数据生成PV环路。使用半自动WebPlotDigitizer程序对容积时间和压力时间曲线进行数字化,并同步重建右心室PV环路,并使用先前验证的单拍方法分析ESPVR。结果:术中房车PV循环生成25例,其中17患者保存房车收缩功能(组1)收缩功能下降患者和8(组2)。意思是ee, Ea和ee / Ea比率分别为0.63±0.25 mm Hg / mL, 0.60±0.23 mm Hg /毫升,8和1.0±0.31毫米汞柱/ mL,分别由Pmax方法和0.56±0.32 mm Hg /毫升,0.60±0.23 mm Hg /毫升,和0.91±0.21毫米汞柱/ mL,分别由V0方法。无论采用何种计算方法,1组的Ees均显著高于2组,且采用V0法计算的Ees/Ea比值较大。结论:从常规血流动力学和超声心动图数据推断右室PV袢在临床上是可行的。在进一步的验证和技术支持下,这可能成为一种潜在的术中心室功能实时监测工具。


 分享
分享

 求助内容:
求助内容: 应助结果提醒方式:
 扫码关注我们
