{"title":"LoVis4u: a locus visualization tool for comparative genomics and coverage profiles.","authors":"Artyom A Egorov, Gemma C Atkinson","doi":"10.1093/nargab/lqaf009","DOIUrl":null,"url":null,"abstract":"<p><p>Comparative genomic analysis often involves visualization of alignments of genomic loci. While several software tools are available for this task, ranging from Python and R libraries to stand-alone graphical user interfaces, a tool is lacking that offers fast, automated usage and the production of publication-ready vector images. Here we present LoVis4u, a command-line tool and Python API designed for highly customizable and fast visualization of multiple genomic loci. LoVis4u generates vector images in PDF format based on annotation data from GenBank or GFF files. It is capable of visualizing entire genomes of bacteriophages as well as plasmids and user-defined regions of longer prokaryotic genomes. Additionally, LoVis4u offers optional data processing steps to identify and highlight accessory and core genes in input sequences. Finally, LoVis4u supports the visualization of genomic signal track profiles from sequencing experiments. LoVis4u is implemented in Python3 and runs on Linux and MacOS. The command-line interface covers most practical use cases, while the provided Python API allows usage within a Python program, integration into external tools, and additional customization. The source code is available at the GitHub page: github.com/art-egorov/lovis4u. Detailed documentation that includes an example-driven guide is available from the software home page: art-egorov.github.io/lovis4u.</p>","PeriodicalId":33994,"journal":{"name":"NAR Genomics and Bioinformatics","volume":"7 1","pages":"lqaf009"},"PeriodicalIF":2.8000,"publicationDate":"2025-02-24","publicationTypes":"Journal Article","fieldsOfStudy":null,"isOpenAccess":false,"openAccessPdf":"https://www.ncbi.nlm.nih.gov/pmc/articles/PMC11850299/pdf/","citationCount":"0","resultStr":null,"platform":"Semanticscholar","paperid":null,"PeriodicalName":"NAR Genomics and Bioinformatics","FirstCategoryId":"1085","ListUrlMain":"https://doi.org/10.1093/nargab/lqaf009","RegionNum":0,"RegionCategory":null,"ArticlePicture":[],"TitleCN":null,"AbstractTextCN":null,"PMCID":null,"EPubDate":"2025/3/1 0:00:00","PubModel":"eCollection","JCR":"Q1","JCRName":"GENETICS & HEREDITY","Score":null,"Total":0}
引用次数: 0
Abstract
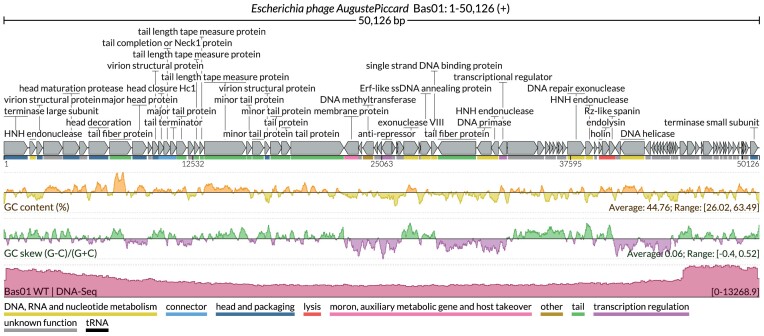
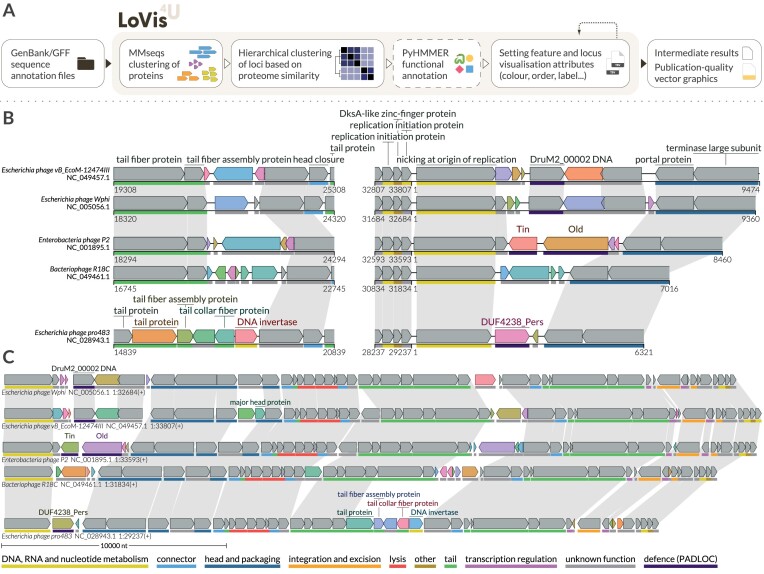
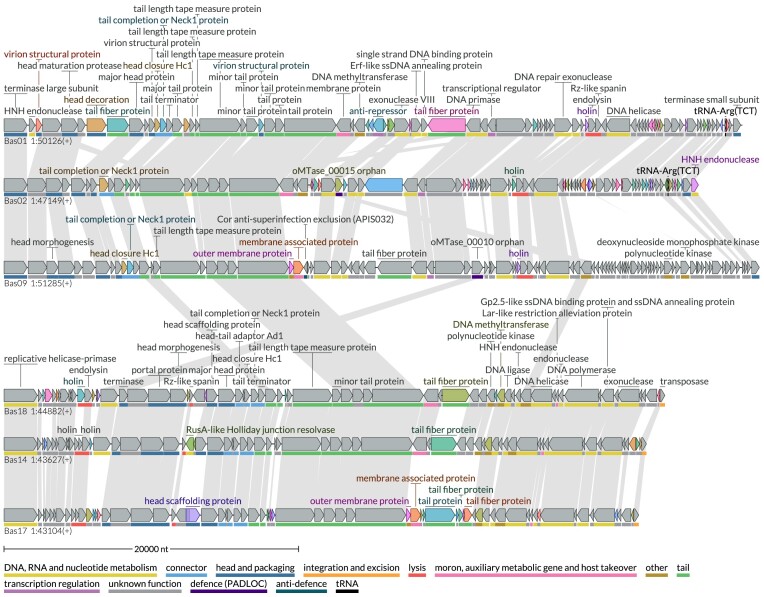
Comparative genomic analysis often involves visualization of alignments of genomic loci. While several software tools are available for this task, ranging from Python and R libraries to stand-alone graphical user interfaces, a tool is lacking that offers fast, automated usage and the production of publication-ready vector images. Here we present LoVis4u, a command-line tool and Python API designed for highly customizable and fast visualization of multiple genomic loci. LoVis4u generates vector images in PDF format based on annotation data from GenBank or GFF files. It is capable of visualizing entire genomes of bacteriophages as well as plasmids and user-defined regions of longer prokaryotic genomes. Additionally, LoVis4u offers optional data processing steps to identify and highlight accessory and core genes in input sequences. Finally, LoVis4u supports the visualization of genomic signal track profiles from sequencing experiments. LoVis4u is implemented in Python3 and runs on Linux and MacOS. The command-line interface covers most practical use cases, while the provided Python API allows usage within a Python program, integration into external tools, and additional customization. The source code is available at the GitHub page: github.com/art-egorov/lovis4u. Detailed documentation that includes an example-driven guide is available from the software home page: art-egorov.github.io/lovis4u.


 分享
分享
 求助内容:
求助内容: 应助结果提醒方式:
 扫码关注我们
