Philippe F Backeljauw, Claudia Boettcher, Michael Højby, Nicky Kelepouris, Mathias Lerbech Jeppesen, Jun Mori, Alberto Pietropoli, Bradley S Miller
{"title":"Growth Response to Weekly Somapacitan Therapy in Children With GH Deficiency Is Related to GH Thresholds in GH Stimulation Testing.","authors":"Philippe F Backeljauw, Claudia Boettcher, Michael Højby, Nicky Kelepouris, Mathias Lerbech Jeppesen, Jun Mori, Alberto Pietropoli, Bradley S Miller","doi":"10.1210/jendso/bvaf038","DOIUrl":null,"url":null,"abstract":"<p><strong>Context: </strong>The lack of a severity definition and standardized GH cutoff level for GH deficiency (GHD) diagnosis in children leads to ambiguity in the interpretation of GH stimulation tests and treatment recommendations.</p><p><strong>Objective: </strong>To investigate treatment response differences among children with GHD treated with daily GH (somatropin) (year 1) or once-weekly somapacitan (years 1 and 2) based on GH peak concentrations assessed at diagnosis.</p><p><strong>Methods: </strong>This was a subgroup analysis of 200 patients with GHD aged ≥2.5 years participating in the REAL4 randomized, phase 3 trial. Height velocity (HV; cm/year) and changes in height SD score (SDS) and IGF-I SDS from baseline were compared for 3 GH peak groups: ≤ 3, >3 to <7, and ≥7 to ≤10 μg/L.</p><p><strong>Results: </strong>The ≤3 μg/L GH peak concentration group had the greatest HV at weeks 52 and 104. Mean change in height SDS ranged from 1.89 to 1.59, 1.17 to 1.06, and 0.92 to 1.07 at week 52 and 2.79 to 2.30, 1.64 to 1.54, and 1.33 to 1.51 at week 104 for the 2 treatment groups across the 3 GH peak concentrations, respectively. Mean change in IGF-I SDS ranged from 3.13 to 3.01, 2.11 to 1.96, and 1.87 to 2.26 at week 52 and from 2.81 to 2.11, 1.85 to 1.62, and 1.28 to 1.71 at week 104 for the 3 GH peak concentrations.</p><p><strong>Conclusion: </strong>Patients with GHD in the ≤3 μg/L GH peak concentration group had greater HV and greater changes in height SDS and IGF-I SDS from baseline.</p>","PeriodicalId":17334,"journal":{"name":"Journal of the Endocrine Society","volume":"9 4","pages":"bvaf038"},"PeriodicalIF":3.1000,"publicationDate":"2025-02-27","publicationTypes":"Journal Article","fieldsOfStudy":null,"isOpenAccess":false,"openAccessPdf":"https://www.ncbi.nlm.nih.gov/pmc/articles/PMC11915089/pdf/","citationCount":"0","resultStr":null,"platform":"Semanticscholar","paperid":null,"PeriodicalName":"Journal of the Endocrine Society","FirstCategoryId":"1085","ListUrlMain":"https://doi.org/10.1210/jendso/bvaf038","RegionNum":0,"RegionCategory":null,"ArticlePicture":[],"TitleCN":null,"AbstractTextCN":null,"PMCID":null,"EPubDate":"2025/3/3 0:00:00","PubModel":"eCollection","JCR":"Q2","JCRName":"ENDOCRINOLOGY & METABOLISM","Score":null,"Total":0}
引用次数: 0
Abstract
Context: The lack of a severity definition and standardized GH cutoff level for GH deficiency (GHD) diagnosis in children leads to ambiguity in the interpretation of GH stimulation tests and treatment recommendations.
Objective: To investigate treatment response differences among children with GHD treated with daily GH (somatropin) (year 1) or once-weekly somapacitan (years 1 and 2) based on GH peak concentrations assessed at diagnosis.
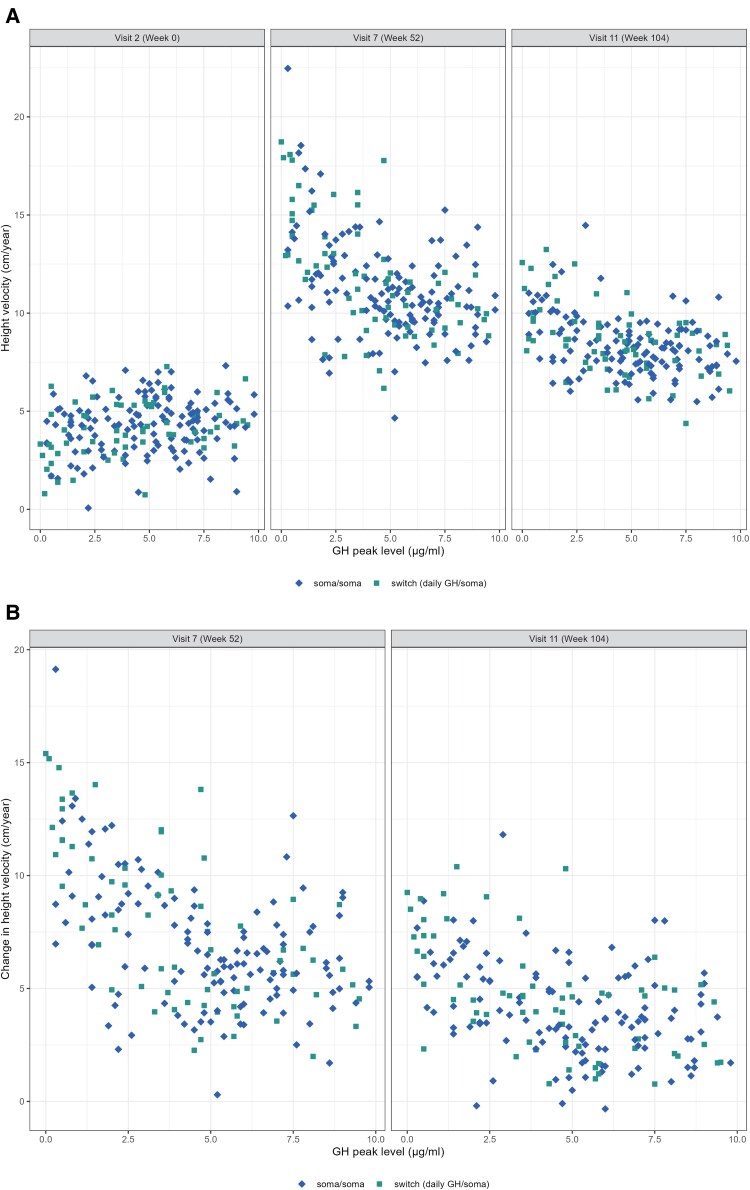
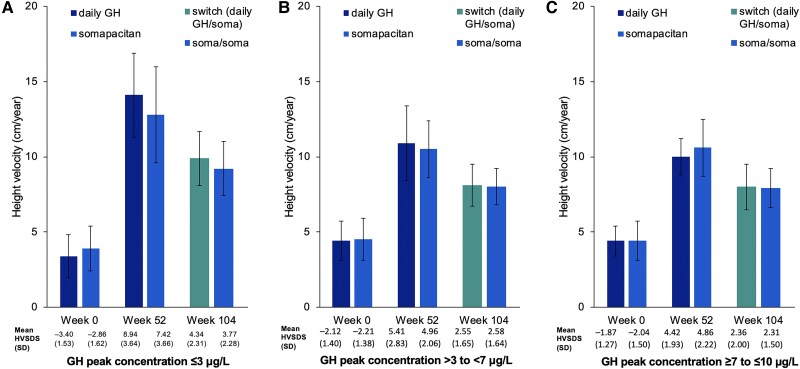
Methods: This was a subgroup analysis of 200 patients with GHD aged ≥2.5 years participating in the REAL4 randomized, phase 3 trial. Height velocity (HV; cm/year) and changes in height SD score (SDS) and IGF-I SDS from baseline were compared for 3 GH peak groups: ≤ 3, >3 to <7, and ≥7 to ≤10 μg/L.
Results: The ≤3 μg/L GH peak concentration group had the greatest HV at weeks 52 and 104. Mean change in height SDS ranged from 1.89 to 1.59, 1.17 to 1.06, and 0.92 to 1.07 at week 52 and 2.79 to 2.30, 1.64 to 1.54, and 1.33 to 1.51 at week 104 for the 2 treatment groups across the 3 GH peak concentrations, respectively. Mean change in IGF-I SDS ranged from 3.13 to 3.01, 2.11 to 1.96, and 1.87 to 2.26 at week 52 and from 2.81 to 2.11, 1.85 to 1.62, and 1.28 to 1.71 at week 104 for the 3 GH peak concentrations.
Conclusion: Patients with GHD in the ≤3 μg/L GH peak concentration group had greater HV and greater changes in height SDS and IGF-I SDS from baseline.


 分享
分享
 求助内容:
求助内容: 应助结果提醒方式:
 扫码关注我们
