Correction to “Targeting the Trypanothione Reductase of Tissue-Residing Leishmania in Hosts’ Reticuloendothelial System: A Flexible Water-Soluble Ferrocenylquinoline-Based Preclinical Drug Candidate”
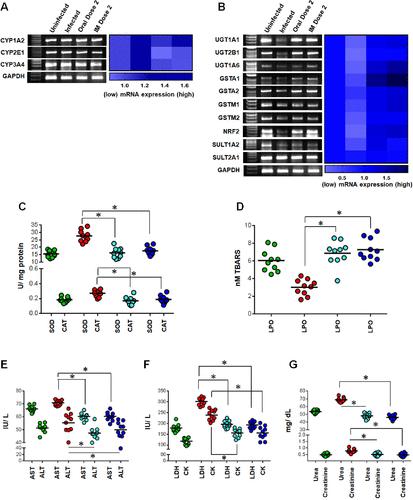
{"title":"Correction to “Targeting the Trypanothione Reductase of Tissue-Residing Leishmania in Hosts’ Reticuloendothelial System: A Flexible Water-Soluble Ferrocenylquinoline-Based Preclinical Drug Candidate”","authors":"Debarati Mukherjee, Md Yousuf, Somaditya Dey, Sondipon Chakraborty, Ankur Chaudhuri, Vinay Kumar, Biswajyoti Sarkar, Supriya Nath, Aabid Hussain, Aritri Dutta, Tanushree Mishra, Biswajit Gopal Roy, Sushma Singh, Sibani Chakraborty, Susanta Adhikari, Chiranjib Pal","doi":"10.1021/acs.jmedchem.5c00610","DOIUrl":null,"url":null,"abstract":"The authors have noticed that the GAPDH panel in Figure 2A and Figures 6A (Phase I detoxyfying enzymes) and 6B (Phase II detoxyfying enzymes) are identical, which has led us to rectify the GAPDH in the revised Figures 6A and 6B. The error in the figure occurred unintentionally during the electronic transfer of the original image files, which were placed in the final Figures 6A and 6B. The rectification of this error does not affect the results or conclusions, as the heat map created using a gradient color scale (densitometry) shown in the figure is indeed based on the original GAPDH (Figure 6A and 6B). All other data published in this article are correct. The supporting data included in the supplementary file (Table S6) will also remain the same as the calculations and the statistical analyses were performed using the original GAPDH. Figure 6. Assessment of the safety profile of CQFC1 toward the host cells, <i>in vivo.</i> (A, B) CQFC1 did not alter phase I (A) and phase II (B) detoxification enzyme components in the host liver, <i>in vivo.</i> Each sample was amplified for mouse GAPDH to ensure equal cDNA input. The densitometry was analyzed by Image Lab software and is represented in heat maps using a gradient color scale. Each square in the heat map represents the mean value of fold changes of respective detoxification enzymes normalized against the expression of GAPDH; the statistical analyses (mean ± SEM and <i>p</i> values) are presented in Supporting Information Table S6. GraphPad Prism software (v 8.0) was used to generate the heat maps from experiments performed in duplicate. (C, D) CQFC1 did not promote oxidative stress as the levels of the antioxidants [SOD and CAT (C; *<i>p</i> < 0.001 vs infection)] and lipid peroxidation products (D; *<i>p</i> < 0.001 vs infection) remained unchanged with respect to the uninfected state (C, D; <i>p</i> > 0.05 vs naive animals). (E–G) CQFC1 had no cytotoxic effect on murine organs also, as seen by the levels of serum biomarker enzymes specific for hepatotoxicity (E; *<i>p</i> < 0.001 vs infection), cardiotoxicity (F; *<i>p</i> < 0.001 vs infection), and nephrotoxicity (G; *<i>p</i> < 0.001 vs infection) with respect to uninfected controls (E–G; <i>p</i> > 0.05 vs naive animals). Scatter plots were prepared using GraphPad Prism software from the cumulative data obtained from at least 5 animals per experimental group in duplicate (uninfected: green; infected: red; oral dose 2: sky blue; and intramuscular dose 2: deep blue). One-way ANOVA followed by Dunnett’s post hoc test was used to compare the variations in means between experimental groups. This article has not yet been cited by other publications.","PeriodicalId":46,"journal":{"name":"Journal of Medicinal Chemistry","volume":"56 1","pages":""},"PeriodicalIF":6.8000,"publicationDate":"2025-03-31","publicationTypes":"Journal Article","fieldsOfStudy":null,"isOpenAccess":false,"openAccessPdf":"","citationCount":"0","resultStr":null,"platform":"Semanticscholar","paperid":null,"PeriodicalName":"Journal of Medicinal Chemistry","FirstCategoryId":"3","ListUrlMain":"https://doi.org/10.1021/acs.jmedchem.5c00610","RegionNum":1,"RegionCategory":"医学","ArticlePicture":[],"TitleCN":null,"AbstractTextCN":null,"PMCID":null,"EPubDate":"","PubModel":"","JCR":"Q1","JCRName":"CHEMISTRY, MEDICINAL","Score":null,"Total":0}
引用次数: 0
Abstract
The authors have noticed that the GAPDH panel in Figure 2A and Figures 6A (Phase I detoxyfying enzymes) and 6B (Phase II detoxyfying enzymes) are identical, which has led us to rectify the GAPDH in the revised Figures 6A and 6B. The error in the figure occurred unintentionally during the electronic transfer of the original image files, which were placed in the final Figures 6A and 6B. The rectification of this error does not affect the results or conclusions, as the heat map created using a gradient color scale (densitometry) shown in the figure is indeed based on the original GAPDH (Figure 6A and 6B). All other data published in this article are correct. The supporting data included in the supplementary file (Table S6) will also remain the same as the calculations and the statistical analyses were performed using the original GAPDH. Figure 6. Assessment of the safety profile of CQFC1 toward the host cells, in vivo. (A, B) CQFC1 did not alter phase I (A) and phase II (B) detoxification enzyme components in the host liver, in vivo. Each sample was amplified for mouse GAPDH to ensure equal cDNA input. The densitometry was analyzed by Image Lab software and is represented in heat maps using a gradient color scale. Each square in the heat map represents the mean value of fold changes of respective detoxification enzymes normalized against the expression of GAPDH; the statistical analyses (mean ± SEM and p values) are presented in Supporting Information Table S6. GraphPad Prism software (v 8.0) was used to generate the heat maps from experiments performed in duplicate. (C, D) CQFC1 did not promote oxidative stress as the levels of the antioxidants [SOD and CAT (C; *p < 0.001 vs infection)] and lipid peroxidation products (D; *p < 0.001 vs infection) remained unchanged with respect to the uninfected state (C, D; p > 0.05 vs naive animals). (E–G) CQFC1 had no cytotoxic effect on murine organs also, as seen by the levels of serum biomarker enzymes specific for hepatotoxicity (E; *p < 0.001 vs infection), cardiotoxicity (F; *p < 0.001 vs infection), and nephrotoxicity (G; *p < 0.001 vs infection) with respect to uninfected controls (E–G; p > 0.05 vs naive animals). Scatter plots were prepared using GraphPad Prism software from the cumulative data obtained from at least 5 animals per experimental group in duplicate (uninfected: green; infected: red; oral dose 2: sky blue; and intramuscular dose 2: deep blue). One-way ANOVA followed by Dunnett’s post hoc test was used to compare the variations in means between experimental groups. This article has not yet been cited by other publications.
期刊介绍:
The Journal of Medicinal Chemistry is a prestigious biweekly peer-reviewed publication that focuses on the multifaceted field of medicinal chemistry. Since its inception in 1959 as the Journal of Medicinal and Pharmaceutical Chemistry, it has evolved to become a cornerstone in the dissemination of research findings related to the design, synthesis, and development of therapeutic agents.
The Journal of Medicinal Chemistry is recognized for its significant impact in the scientific community, as evidenced by its 2022 impact factor of 7.3. This metric reflects the journal's influence and the importance of its content in shaping the future of drug discovery and development. The journal serves as a vital resource for chemists, pharmacologists, and other researchers interested in the molecular mechanisms of drug action and the optimization of therapeutic compounds.


 分享
分享
 求助内容:
求助内容: 应助结果提醒方式:
 扫码关注我们
