Didac Florensa, Jordi Mateo-Fornes, Sergi Lopez Sorribes, Anna Torres Tuca, Francesc Solsona, Pere Godoy
{"title":"Exploring Cancer Incidence, Risk Factors, and Mortality in the Lleida Region: Interactive, Open-source R Shiny Application for Cancer Data Analysis.","authors":"Didac Florensa, Jordi Mateo-Fornes, Sergi Lopez Sorribes, Anna Torres Tuca, Francesc Solsona, Pere Godoy","doi":"10.2196/44695","DOIUrl":null,"url":null,"abstract":"<p><strong>Background: </strong>The cancer incidence rate is essential to public health surveillance. The analysis of this information allows authorities to know the cancer situation in their regions, especially to determine cancer patterns, monitor cancer trends, and help prioritize the allocation of health resource.</p><p><strong>Objective: </strong>This study aimed to present the design and implementation of an R Shiny application to assist cancer registries conduct rapid descriptive and predictive analytics in a user-friendly, intuitive, portable, and scalable way. Moreover, we wanted to describe the design and implementation road map to inspire other population registries to exploit their data sets and develop similar tools and models.</p><p><strong>Methods: </strong>The first step was to consolidate the data into the population registry cancer database. These data were cross validated by ASEDAT software, checked later, and reviewed by experts. Next, we developed an online tool to visualize the data and generate reports to assist decision-making under the R Shiny framework. Currently, the application can generate descriptive analytics using population variables, such as age, sex, and cancer type; cancer incidence in region-level geographical heat maps; line plots to visualize temporal trends; and typical risk factor plots. The application also showed descriptive plots about cancer mortality in the Lleida region. This web platform was built as a microservices cloud platform. The web back end consists of an application programming interface and a database, which NodeJS and MongoDB have implemented. All these parts were encapsulated and deployed by Docker and Docker Compose.</p><p><strong>Results: </strong>The results provide a successful case study in which the tool was applied to the cancer registry of the Lleida region. The study illustrates how researchers and cancer registries can use the application to analyze cancer databases. Furthermore, the results highlight the analytics related to risk factors, second tumors, and cancer mortality. The application shows the incidence and evolution of each cancer during a specific period for gender, age groups, and cancer location, among other functionalities. The risk factors view permitted us to detect that approximately 60% of cancer patients were diagnosed with excess weight at diagnosis. Regarding mortality, the application showed that lung cancer registered the highest number of deaths for both genders. Breast cancer was the lethal cancer in women. Finally, a customization guide was included as a result of this implementation to deploy the architecture presented.</p><p><strong>Conclusions: </strong>This paper aimed to document a successful methodology for exploiting the data in population cancer registries and propose guidelines for other similar records to develop similar tools. We intend to inspire other entities to build an application that can help decision-making and make data more accessible and transparent for the community of users.</p>","PeriodicalId":45538,"journal":{"name":"JMIR Cancer","volume":"9 ","pages":"e44695"},"PeriodicalIF":2.7000,"publicationDate":"2023-04-20","publicationTypes":"Journal Article","fieldsOfStudy":null,"isOpenAccess":false,"openAccessPdf":"https://www.ncbi.nlm.nih.gov/pmc/articles/PMC10160936/pdf/","citationCount":"0","resultStr":null,"platform":"Semanticscholar","paperid":null,"PeriodicalName":"JMIR Cancer","FirstCategoryId":"1085","ListUrlMain":"https://doi.org/10.2196/44695","RegionNum":0,"RegionCategory":null,"ArticlePicture":[],"TitleCN":null,"AbstractTextCN":null,"PMCID":null,"EPubDate":"","PubModel":"","JCR":"Q2","JCRName":"ONCOLOGY","Score":null,"Total":0}
引用次数: 0
Abstract
Background: The cancer incidence rate is essential to public health surveillance. The analysis of this information allows authorities to know the cancer situation in their regions, especially to determine cancer patterns, monitor cancer trends, and help prioritize the allocation of health resource.
Objective: This study aimed to present the design and implementation of an R Shiny application to assist cancer registries conduct rapid descriptive and predictive analytics in a user-friendly, intuitive, portable, and scalable way. Moreover, we wanted to describe the design and implementation road map to inspire other population registries to exploit their data sets and develop similar tools and models.
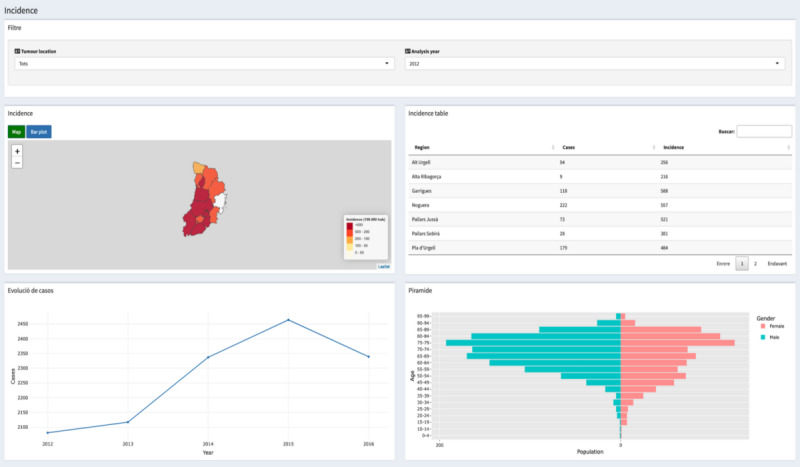
Methods: The first step was to consolidate the data into the population registry cancer database. These data were cross validated by ASEDAT software, checked later, and reviewed by experts. Next, we developed an online tool to visualize the data and generate reports to assist decision-making under the R Shiny framework. Currently, the application can generate descriptive analytics using population variables, such as age, sex, and cancer type; cancer incidence in region-level geographical heat maps; line plots to visualize temporal trends; and typical risk factor plots. The application also showed descriptive plots about cancer mortality in the Lleida region. This web platform was built as a microservices cloud platform. The web back end consists of an application programming interface and a database, which NodeJS and MongoDB have implemented. All these parts were encapsulated and deployed by Docker and Docker Compose.
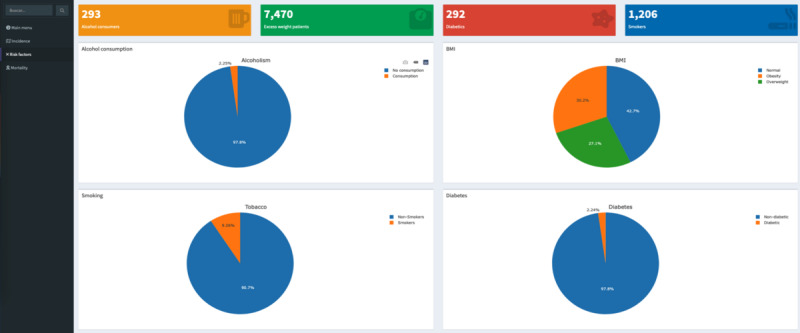
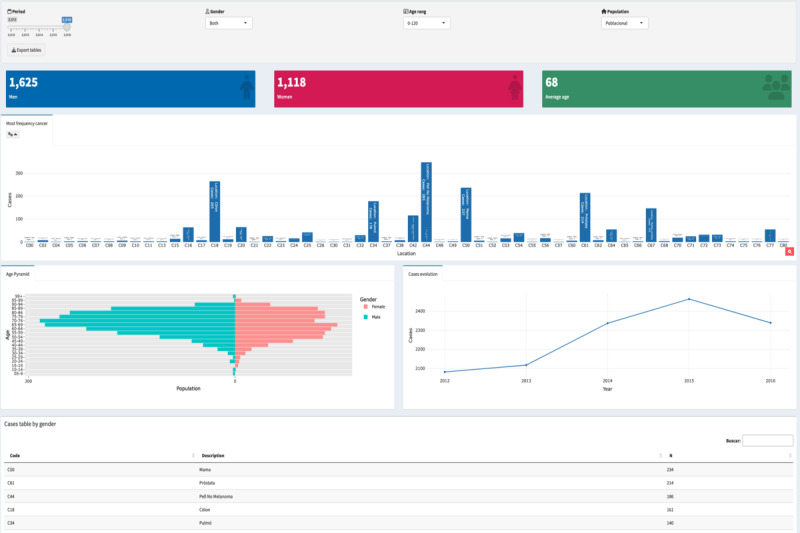
Results: The results provide a successful case study in which the tool was applied to the cancer registry of the Lleida region. The study illustrates how researchers and cancer registries can use the application to analyze cancer databases. Furthermore, the results highlight the analytics related to risk factors, second tumors, and cancer mortality. The application shows the incidence and evolution of each cancer during a specific period for gender, age groups, and cancer location, among other functionalities. The risk factors view permitted us to detect that approximately 60% of cancer patients were diagnosed with excess weight at diagnosis. Regarding mortality, the application showed that lung cancer registered the highest number of deaths for both genders. Breast cancer was the lethal cancer in women. Finally, a customization guide was included as a result of this implementation to deploy the architecture presented.
Conclusions: This paper aimed to document a successful methodology for exploiting the data in population cancer registries and propose guidelines for other similar records to develop similar tools. We intend to inspire other entities to build an application that can help decision-making and make data more accessible and transparent for the community of users.


 分享
分享
 求助内容:
求助内容: 应助结果提醒方式:
 扫码关注我们
