Muhammad Arif Goheer, Bibi Aftab, Humera Farah, Sher Shah Hassan
{"title":"利用遥感和地理空间技术对巴基斯坦多雨地区波托哈尔的农业和气象干旱进行时空风险分析","authors":"Muhammad Arif Goheer, Bibi Aftab, Humera Farah, Sher Shah Hassan","doi":"10.1002/met.2138","DOIUrl":null,"url":null,"abstract":"<p>Droughts of various types are considered as a major threat to rainfed agriculture, because agricultural production is dependent on the spatio-temporal distribution of rainfall. The rainfed regions of Pakistan, such as Potohar, have experienced several instances of drought since 2000. The most drought-affected staple crop of the region is wheat, which ultimately affects regional food security. In this study, we examine the agricultural and the meteorological droughts in the Potohar region during 2000–2020, to create a drought risk map. This region comprises four districts, namely Attock, Chakwal, Jhelum and Rawalpindi. First, the agricultural and meteorological drought severity maps were created using rainfall data (meteorological data) and vegetation indices for three different periods (i.e., drought year, moderate drought year and normal year). The agricultural drought patterns and intensity were identified and evaluated using the MODIS products MOD09A1 and MOD11A2, while the meteorological droughts were identified using CHRIPS rainfall data. Afterwards, a combined drought risk map was generated by integrating the agricultural and meteorological adrought severity maps using a weighted overlay analysis. This drought risk map showed that Attock and Rawalpindi were expeiencing slight to no drought conditions, whereas the southwestern and central parts of Chakwal showed moderate drought conditions. Similarly, the western parts of Jhelum faced moderate drought conditions. Thus, the combined drought risk map may be a useful guide for decision makers in the local and provincial government. Using this map, they can identify adaptation practices in the drought-prone areas of this region for enhancing agricultural productivity.</p>","PeriodicalId":49825,"journal":{"name":"Meteorological Applications","volume":"30 6","pages":""},"PeriodicalIF":2.5000,"publicationDate":"2023-12-10","publicationTypes":"Journal Article","fieldsOfStudy":null,"isOpenAccess":false,"openAccessPdf":"https://rmets.onlinelibrary.wiley.com/doi/epdf/10.1002/met.2138","citationCount":"0","resultStr":"{\"title\":\"Spatio-temporal risk analysis of agriculture and meteorological droughts in rainfed Potohar, Pakistan, using remote sensing and geospatial techniques\",\"authors\":\"Muhammad Arif Goheer, Bibi Aftab, Humera Farah, Sher Shah Hassan\",\"doi\":\"10.1002/met.2138\",\"DOIUrl\":null,\"url\":null,\"abstract\":\"<p>Droughts of various types are considered as a major threat to rainfed agriculture, because agricultural production is dependent on the spatio-temporal distribution of rainfall. The rainfed regions of Pakistan, such as Potohar, have experienced several instances of drought since 2000. The most drought-affected staple crop of the region is wheat, which ultimately affects regional food security. In this study, we examine the agricultural and the meteorological droughts in the Potohar region during 2000–2020, to create a drought risk map. This region comprises four districts, namely Attock, Chakwal, Jhelum and Rawalpindi. First, the agricultural and meteorological drought severity maps were created using rainfall data (meteorological data) and vegetation indices for three different periods (i.e., drought year, moderate drought year and normal year). The agricultural drought patterns and intensity were identified and evaluated using the MODIS products MOD09A1 and MOD11A2, while the meteorological droughts were identified using CHRIPS rainfall data. Afterwards, a combined drought risk map was generated by integrating the agricultural and meteorological adrought severity maps using a weighted overlay analysis. This drought risk map showed that Attock and Rawalpindi were expeiencing slight to no drought conditions, whereas the southwestern and central parts of Chakwal showed moderate drought conditions. Similarly, the western parts of Jhelum faced moderate drought conditions. Thus, the combined drought risk map may be a useful guide for decision makers in the local and provincial government. Using this map, they can identify adaptation practices in the drought-prone areas of this region for enhancing agricultural productivity.</p>\",\"PeriodicalId\":49825,\"journal\":{\"name\":\"Meteorological Applications\",\"volume\":\"30 6\",\"pages\":\"\"},\"PeriodicalIF\":2.5000,\"publicationDate\":\"2023-12-10\",\"publicationTypes\":\"Journal Article\",\"fieldsOfStudy\":null,\"isOpenAccess\":false,\"openAccessPdf\":\"https://rmets.onlinelibrary.wiley.com/doi/epdf/10.1002/met.2138\",\"citationCount\":\"0\",\"resultStr\":null,\"platform\":\"Semanticscholar\",\"paperid\":null,\"PeriodicalName\":\"Meteorological Applications\",\"FirstCategoryId\":\"89\",\"ListUrlMain\":\"https://onlinelibrary.wiley.com/doi/10.1002/met.2138\",\"RegionNum\":4,\"RegionCategory\":\"地球科学\",\"ArticlePicture\":[],\"TitleCN\":null,\"AbstractTextCN\":null,\"PMCID\":null,\"EPubDate\":\"\",\"PubModel\":\"\",\"JCR\":\"Q3\",\"JCRName\":\"METEOROLOGY & ATMOSPHERIC SCIENCES\",\"Score\":null,\"Total\":0}","platform":"Semanticscholar","paperid":null,"PeriodicalName":"Meteorological Applications","FirstCategoryId":"89","ListUrlMain":"https://onlinelibrary.wiley.com/doi/10.1002/met.2138","RegionNum":4,"RegionCategory":"地球科学","ArticlePicture":[],"TitleCN":null,"AbstractTextCN":null,"PMCID":null,"EPubDate":"","PubModel":"","JCR":"Q3","JCRName":"METEOROLOGY & ATMOSPHERIC SCIENCES","Score":null,"Total":0}
Spatio-temporal risk analysis of agriculture and meteorological droughts in rainfed Potohar, Pakistan, using remote sensing and geospatial techniques
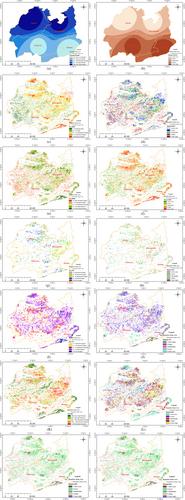
Droughts of various types are considered as a major threat to rainfed agriculture, because agricultural production is dependent on the spatio-temporal distribution of rainfall. The rainfed regions of Pakistan, such as Potohar, have experienced several instances of drought since 2000. The most drought-affected staple crop of the region is wheat, which ultimately affects regional food security. In this study, we examine the agricultural and the meteorological droughts in the Potohar region during 2000–2020, to create a drought risk map. This region comprises four districts, namely Attock, Chakwal, Jhelum and Rawalpindi. First, the agricultural and meteorological drought severity maps were created using rainfall data (meteorological data) and vegetation indices for three different periods (i.e., drought year, moderate drought year and normal year). The agricultural drought patterns and intensity were identified and evaluated using the MODIS products MOD09A1 and MOD11A2, while the meteorological droughts were identified using CHRIPS rainfall data. Afterwards, a combined drought risk map was generated by integrating the agricultural and meteorological adrought severity maps using a weighted overlay analysis. This drought risk map showed that Attock and Rawalpindi were expeiencing slight to no drought conditions, whereas the southwestern and central parts of Chakwal showed moderate drought conditions. Similarly, the western parts of Jhelum faced moderate drought conditions. Thus, the combined drought risk map may be a useful guide for decision makers in the local and provincial government. Using this map, they can identify adaptation practices in the drought-prone areas of this region for enhancing agricultural productivity.
期刊介绍:
The aim of Meteorological Applications is to serve the needs of applied meteorologists, forecasters and users of meteorological services by publishing papers on all aspects of meteorological science, including:
applications of meteorological, climatological, analytical and forecasting data, and their socio-economic benefits;
forecasting, warning and service delivery techniques and methods;
weather hazards, their analysis and prediction;
performance, verification and value of numerical models and forecasting services;
practical applications of ocean and climate models;
education and training.


 分享
分享
 求助内容:
求助内容: 应助结果提醒方式:
 扫码关注我们
