{"title":"胎儿和新生儿生长曲线的比较分析","authors":"Josep Figueras Aloy , Montserrat Izquierdo Renau , Ana Herranz Barbero , Lourdes Urquía Martí , Fermín García-Muñoz Rodrigo , Martín Iriondo Sanz , Óscar García Algar","doi":"10.1016/j.anpedi.2024.02.014","DOIUrl":null,"url":null,"abstract":"<div><h3>Introduction</h3><p>Our aim was to determine which foetal or neonatal growth curves discriminate the probability of dying of newborns with low birth weight for their gestational age (small for gestational age, SGA) and sex (weight <<!--> <!-->10th percentile) and to establish the curves that are presumably most useful for monitoring growth through age 10 years.</p></div><div><h3>Material and methods</h3><p>The analysis included every neonate (15 122) managed in our hospital (2013-2022) and all neonates born preterm before 32 weeks (6913) registered in the SEN1500 database (2019-2022). We considered most useful those curves with the highest likelihood ratio (LR) for dying with or without a history of SGA in each subgroup of gestational ages. Theoretically, the optimal curves for monitoring growth would be those with a higher <em>R</em><sup>2</sup> in the quantile regression formulas for the 50th percentile.</p></div><div><h3>Results</h3><p>The growth curves exhibiting the strongest association between SGA and hospital mortality are the Intergrowth fetal curves and the Fenton neonatal curves in infants born preterm before 32 weeks. However, the optimal curves for premature babies and neonates overall were those of Olsen and Intergrowth. The most useful curves to monitor anthropometric values alone until age 10 years of age are the longitudinal Intergrowth curves and WHO standards, but if a single reference is desired from birth through age 10 years, the best option is the Fenton curves followed by the WHO standards.</p></div><div><h3>Conclusions</h3><p>The Intergrowth reference provides the most discriminating foetal growth curves. In neonatal clinical practice, the optimal references are the Fenton and the WHO charts.</p></div>","PeriodicalId":7783,"journal":{"name":"Anales de pediatria","volume":"100 5","pages":"Pages 333-341"},"PeriodicalIF":2.6000,"publicationDate":"2024-05-01","publicationTypes":"Journal Article","fieldsOfStudy":null,"isOpenAccess":false,"openAccessPdf":"https://www.sciencedirect.com/science/article/pii/S1695403324000468/pdfft?md5=997ea9558f97a744a13b3592097af20c&pid=1-s2.0-S1695403324000468-main.pdf","citationCount":"0","resultStr":"{\"title\":\"Análisis comparativo de las curvas de crecimiento fetal y neonatal\",\"authors\":\"Josep Figueras Aloy , Montserrat Izquierdo Renau , Ana Herranz Barbero , Lourdes Urquía Martí , Fermín García-Muñoz Rodrigo , Martín Iriondo Sanz , Óscar García Algar\",\"doi\":\"10.1016/j.anpedi.2024.02.014\",\"DOIUrl\":null,\"url\":null,\"abstract\":\"<div><h3>Introduction</h3><p>Our aim was to determine which foetal or neonatal growth curves discriminate the probability of dying of newborns with low birth weight for their gestational age (small for gestational age, SGA) and sex (weight <<!--> <!-->10th percentile) and to establish the curves that are presumably most useful for monitoring growth through age 10 years.</p></div><div><h3>Material and methods</h3><p>The analysis included every neonate (15 122) managed in our hospital (2013-2022) and all neonates born preterm before 32 weeks (6913) registered in the SEN1500 database (2019-2022). We considered most useful those curves with the highest likelihood ratio (LR) for dying with or without a history of SGA in each subgroup of gestational ages. Theoretically, the optimal curves for monitoring growth would be those with a higher <em>R</em><sup>2</sup> in the quantile regression formulas for the 50th percentile.</p></div><div><h3>Results</h3><p>The growth curves exhibiting the strongest association between SGA and hospital mortality are the Intergrowth fetal curves and the Fenton neonatal curves in infants born preterm before 32 weeks. However, the optimal curves for premature babies and neonates overall were those of Olsen and Intergrowth. The most useful curves to monitor anthropometric values alone until age 10 years of age are the longitudinal Intergrowth curves and WHO standards, but if a single reference is desired from birth through age 10 years, the best option is the Fenton curves followed by the WHO standards.</p></div><div><h3>Conclusions</h3><p>The Intergrowth reference provides the most discriminating foetal growth curves. In neonatal clinical practice, the optimal references are the Fenton and the WHO charts.</p></div>\",\"PeriodicalId\":7783,\"journal\":{\"name\":\"Anales de pediatria\",\"volume\":\"100 5\",\"pages\":\"Pages 333-341\"},\"PeriodicalIF\":2.6000,\"publicationDate\":\"2024-05-01\",\"publicationTypes\":\"Journal Article\",\"fieldsOfStudy\":null,\"isOpenAccess\":false,\"openAccessPdf\":\"https://www.sciencedirect.com/science/article/pii/S1695403324000468/pdfft?md5=997ea9558f97a744a13b3592097af20c&pid=1-s2.0-S1695403324000468-main.pdf\",\"citationCount\":\"0\",\"resultStr\":null,\"platform\":\"Semanticscholar\",\"paperid\":null,\"PeriodicalName\":\"Anales de pediatria\",\"FirstCategoryId\":\"3\",\"ListUrlMain\":\"https://www.sciencedirect.com/science/article/pii/S1695403324000468\",\"RegionNum\":4,\"RegionCategory\":\"医学\",\"ArticlePicture\":[],\"TitleCN\":null,\"AbstractTextCN\":null,\"PMCID\":null,\"EPubDate\":\"2024/3/11 0:00:00\",\"PubModel\":\"Epub\",\"JCR\":\"Q2\",\"JCRName\":\"PEDIATRICS\",\"Score\":null,\"Total\":0}","platform":"Semanticscholar","paperid":null,"PeriodicalName":"Anales de pediatria","FirstCategoryId":"3","ListUrlMain":"https://www.sciencedirect.com/science/article/pii/S1695403324000468","RegionNum":4,"RegionCategory":"医学","ArticlePicture":[],"TitleCN":null,"AbstractTextCN":null,"PMCID":null,"EPubDate":"2024/3/11 0:00:00","PubModel":"Epub","JCR":"Q2","JCRName":"PEDIATRICS","Score":null,"Total":0}
Análisis comparativo de las curvas de crecimiento fetal y neonatal
Introduction
Our aim was to determine which foetal or neonatal growth curves discriminate the probability of dying of newborns with low birth weight for their gestational age (small for gestational age, SGA) and sex (weight < 10th percentile) and to establish the curves that are presumably most useful for monitoring growth through age 10 years.
Material and methods
The analysis included every neonate (15 122) managed in our hospital (2013-2022) and all neonates born preterm before 32 weeks (6913) registered in the SEN1500 database (2019-2022). We considered most useful those curves with the highest likelihood ratio (LR) for dying with or without a history of SGA in each subgroup of gestational ages. Theoretically, the optimal curves for monitoring growth would be those with a higher R2 in the quantile regression formulas for the 50th percentile.
Results
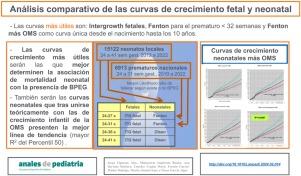
The growth curves exhibiting the strongest association between SGA and hospital mortality are the Intergrowth fetal curves and the Fenton neonatal curves in infants born preterm before 32 weeks. However, the optimal curves for premature babies and neonates overall were those of Olsen and Intergrowth. The most useful curves to monitor anthropometric values alone until age 10 years of age are the longitudinal Intergrowth curves and WHO standards, but if a single reference is desired from birth through age 10 years, the best option is the Fenton curves followed by the WHO standards.
Conclusions
The Intergrowth reference provides the most discriminating foetal growth curves. In neonatal clinical practice, the optimal references are the Fenton and the WHO charts.
期刊介绍:
La Asociación Española de Pediatría tiene como uno de sus objetivos principales la difusión de información científica rigurosa y actualizada sobre las distintas áreas de la pediatría. Anales de Pediatría es el Órgano de Expresión Científica de la Asociación y constituye el vehículo a través del cual se comunican los asociados. Publica trabajos originales sobre investigación clínica en pediatría procedentes de España y países latinoamericanos, así como artículos de revisión elaborados por los mejores profesionales de cada especialidad, las comunicaciones del congreso anual y los libros de actas de la Asociación, y guías de actuación elaboradas por las diferentes Sociedades/Secciones Especializadas integradas en la Asociación Española de Pediatría.


 分享
分享
 求助内容:
求助内容: 应助结果提醒方式:
 扫码关注我们
