Hannah Crook BSPH, Manuel Horta MEd, Kenneth A. Michelson MD, MPH, John A. Graves PhD
{"title":"医疗保健服务区域定义在捕捉住院护理和健康社会决定因素差异方面的表现","authors":"Hannah Crook BSPH, Manuel Horta MEd, Kenneth A. Michelson MD, MPH, John A. Graves PhD","doi":"10.1111/1475-6773.14312","DOIUrl":null,"url":null,"abstract":"<div>\n \n \n <section>\n \n <h3> Objective</h3>\n \n <p>To quantify the degree to which health care service area (HCSA) definitions captured hospitalizations and heterogeneity in social determinants of health (SDOH).</p>\n </section>\n \n <section>\n \n <h3> Data Sources and Study Setting</h3>\n \n <p>Geospatial data from the Centers for Medicare and Medicaid Services, the Census Bureau, and the Dartmouth Institute. Drive-time isochrones from MapBox. Area Deprivation Index (ADI) data. 2017 inpatient discharge data from Arizona, Florida, Iowa, Maryland, Nebraska, New Jersey, New York, and Wisconsin, State Emergency Department Databases and State Inpatient Databases, Healthcare Cost and Utilization Project, Agency for Healthcare Research and Quality; and Fee-For-Service Medicare data in 48 states.</p>\n </section>\n \n <section>\n \n <h3> Study Design</h3>\n \n <p>Cross-sectional, descriptive analysis.</p>\n </section>\n \n <section>\n \n <h3> Data Collection/Extraction Methods</h3>\n \n <p>The capture rate was the percentage of inpatient discharges occurring in the same HCSA as the hospital. We compared capture rates for each HCSA definition for different populations and by hospital type. We measured SDOH heterogeneity using the coefficient of variation of the ADI among ZIP codes within each HCSA.</p>\n </section>\n \n <section>\n \n <h3> Principal Findings</h3>\n \n <p>HCSA definitions captured a wide range of inpatient discharges, ranging from 20% to 50% for Public Use Microdata Areas (PUMAs) to 93%–97% for Metropolitan Statistical Areas (MSAs). Three-quarters of inpatient discharges were from facilities within the same county as the patient's residential ZIP code, while nearly two-thirds were within the same Hospital Service Area. From the hospital perspective, 74.7% of inpatient discharges originated from within a 30-min drive and 90.1% within a 60-min drive. Capture rates were the lowest for teaching hospitals. PUMAs and drive-time-based HCSAs encompassed more homogenous populations while MSAs, Commuting Zones, and Hospital Referral Regions captured the most variation.</p>\n </section>\n \n <section>\n \n <h3> Conclusions</h3>\n \n <p>The proportion of hospital discharges captured by each HCSA varied, with MSAs capturing the highest proportion of discharges and PUMAs capturing the lowest. Additionally, researchers face a trade-off between capture rate and population homogeneity when deciding which HCSA to use.</p>\n </section>\n </div>","PeriodicalId":55065,"journal":{"name":"Health Services Research","volume":"59 4","pages":""},"PeriodicalIF":3.2000,"publicationDate":"2024-05-02","publicationTypes":"Journal Article","fieldsOfStudy":null,"isOpenAccess":false,"openAccessPdf":"https://onlinelibrary.wiley.com/doi/epdf/10.1111/1475-6773.14312","citationCount":"0","resultStr":"{\"title\":\"Performance of health care service area definitions for capturing variation in inpatient care and social determinants of health\",\"authors\":\"Hannah Crook BSPH, Manuel Horta MEd, Kenneth A. Michelson MD, MPH, John A. Graves PhD\",\"doi\":\"10.1111/1475-6773.14312\",\"DOIUrl\":null,\"url\":null,\"abstract\":\"<div>\\n \\n \\n <section>\\n \\n <h3> Objective</h3>\\n \\n <p>To quantify the degree to which health care service area (HCSA) definitions captured hospitalizations and heterogeneity in social determinants of health (SDOH).</p>\\n </section>\\n \\n <section>\\n \\n <h3> Data Sources and Study Setting</h3>\\n \\n <p>Geospatial data from the Centers for Medicare and Medicaid Services, the Census Bureau, and the Dartmouth Institute. Drive-time isochrones from MapBox. Area Deprivation Index (ADI) data. 2017 inpatient discharge data from Arizona, Florida, Iowa, Maryland, Nebraska, New Jersey, New York, and Wisconsin, State Emergency Department Databases and State Inpatient Databases, Healthcare Cost and Utilization Project, Agency for Healthcare Research and Quality; and Fee-For-Service Medicare data in 48 states.</p>\\n </section>\\n \\n <section>\\n \\n <h3> Study Design</h3>\\n \\n <p>Cross-sectional, descriptive analysis.</p>\\n </section>\\n \\n <section>\\n \\n <h3> Data Collection/Extraction Methods</h3>\\n \\n <p>The capture rate was the percentage of inpatient discharges occurring in the same HCSA as the hospital. We compared capture rates for each HCSA definition for different populations and by hospital type. We measured SDOH heterogeneity using the coefficient of variation of the ADI among ZIP codes within each HCSA.</p>\\n </section>\\n \\n <section>\\n \\n <h3> Principal Findings</h3>\\n \\n <p>HCSA definitions captured a wide range of inpatient discharges, ranging from 20% to 50% for Public Use Microdata Areas (PUMAs) to 93%–97% for Metropolitan Statistical Areas (MSAs). Three-quarters of inpatient discharges were from facilities within the same county as the patient's residential ZIP code, while nearly two-thirds were within the same Hospital Service Area. From the hospital perspective, 74.7% of inpatient discharges originated from within a 30-min drive and 90.1% within a 60-min drive. Capture rates were the lowest for teaching hospitals. PUMAs and drive-time-based HCSAs encompassed more homogenous populations while MSAs, Commuting Zones, and Hospital Referral Regions captured the most variation.</p>\\n </section>\\n \\n <section>\\n \\n <h3> Conclusions</h3>\\n \\n <p>The proportion of hospital discharges captured by each HCSA varied, with MSAs capturing the highest proportion of discharges and PUMAs capturing the lowest. Additionally, researchers face a trade-off between capture rate and population homogeneity when deciding which HCSA to use.</p>\\n </section>\\n </div>\",\"PeriodicalId\":55065,\"journal\":{\"name\":\"Health Services Research\",\"volume\":\"59 4\",\"pages\":\"\"},\"PeriodicalIF\":3.2000,\"publicationDate\":\"2024-05-02\",\"publicationTypes\":\"Journal Article\",\"fieldsOfStudy\":null,\"isOpenAccess\":false,\"openAccessPdf\":\"https://onlinelibrary.wiley.com/doi/epdf/10.1111/1475-6773.14312\",\"citationCount\":\"0\",\"resultStr\":null,\"platform\":\"Semanticscholar\",\"paperid\":null,\"PeriodicalName\":\"Health Services Research\",\"FirstCategoryId\":\"3\",\"ListUrlMain\":\"https://onlinelibrary.wiley.com/doi/10.1111/1475-6773.14312\",\"RegionNum\":2,\"RegionCategory\":\"医学\",\"ArticlePicture\":[],\"TitleCN\":null,\"AbstractTextCN\":null,\"PMCID\":null,\"EPubDate\":\"\",\"PubModel\":\"\",\"JCR\":\"Q2\",\"JCRName\":\"HEALTH CARE SCIENCES & SERVICES\",\"Score\":null,\"Total\":0}","platform":"Semanticscholar","paperid":null,"PeriodicalName":"Health Services Research","FirstCategoryId":"3","ListUrlMain":"https://onlinelibrary.wiley.com/doi/10.1111/1475-6773.14312","RegionNum":2,"RegionCategory":"医学","ArticlePicture":[],"TitleCN":null,"AbstractTextCN":null,"PMCID":null,"EPubDate":"","PubModel":"","JCR":"Q2","JCRName":"HEALTH CARE SCIENCES & SERVICES","Score":null,"Total":0}
Performance of health care service area definitions for capturing variation in inpatient care and social determinants of health
Objective
To quantify the degree to which health care service area (HCSA) definitions captured hospitalizations and heterogeneity in social determinants of health (SDOH).
Data Sources and Study Setting
Geospatial data from the Centers for Medicare and Medicaid Services, the Census Bureau, and the Dartmouth Institute. Drive-time isochrones from MapBox. Area Deprivation Index (ADI) data. 2017 inpatient discharge data from Arizona, Florida, Iowa, Maryland, Nebraska, New Jersey, New York, and Wisconsin, State Emergency Department Databases and State Inpatient Databases, Healthcare Cost and Utilization Project, Agency for Healthcare Research and Quality; and Fee-For-Service Medicare data in 48 states.
Study Design
Cross-sectional, descriptive analysis.
Data Collection/Extraction Methods
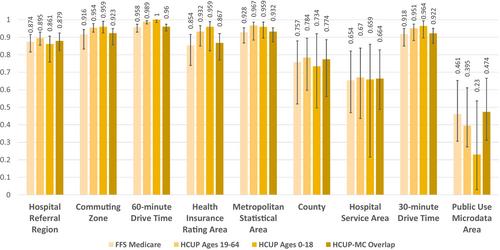
The capture rate was the percentage of inpatient discharges occurring in the same HCSA as the hospital. We compared capture rates for each HCSA definition for different populations and by hospital type. We measured SDOH heterogeneity using the coefficient of variation of the ADI among ZIP codes within each HCSA.
Principal Findings
HCSA definitions captured a wide range of inpatient discharges, ranging from 20% to 50% for Public Use Microdata Areas (PUMAs) to 93%–97% for Metropolitan Statistical Areas (MSAs). Three-quarters of inpatient discharges were from facilities within the same county as the patient's residential ZIP code, while nearly two-thirds were within the same Hospital Service Area. From the hospital perspective, 74.7% of inpatient discharges originated from within a 30-min drive and 90.1% within a 60-min drive. Capture rates were the lowest for teaching hospitals. PUMAs and drive-time-based HCSAs encompassed more homogenous populations while MSAs, Commuting Zones, and Hospital Referral Regions captured the most variation.
Conclusions
The proportion of hospital discharges captured by each HCSA varied, with MSAs capturing the highest proportion of discharges and PUMAs capturing the lowest. Additionally, researchers face a trade-off between capture rate and population homogeneity when deciding which HCSA to use.
期刊介绍:
Health Services Research (HSR) is a peer-reviewed scholarly journal that provides researchers and public and private policymakers with the latest research findings, methods, and concepts related to the financing, organization, delivery, evaluation, and outcomes of health services. Rated as one of the top journals in the fields of health policy and services and health care administration, HSR publishes outstanding articles reporting the findings of original investigations that expand knowledge and understanding of the wide-ranging field of health care and that will help to improve the health of individuals and communities.


 分享
分享
 求助内容:
求助内容: 应助结果提醒方式:
 扫码关注我们
