Priya Saxena, Ankit Kumar, Mohd Muzammil, Sreekanth Bojjagani, Devendra Kumar Patel, Alka Kumari, Altaf Husain Khan, Ganesh Chandra Kisku
{"title":"印度勒克瑙市环境污染物的时空分布和来源。","authors":"Priya Saxena, Ankit Kumar, Mohd Muzammil, Sreekanth Bojjagani, Devendra Kumar Patel, Alka Kumari, Altaf Husain Khan, Ganesh Chandra Kisku","doi":"10.1007/s10661-024-12832-7","DOIUrl":null,"url":null,"abstract":"<p><p>Clean air is imperative to the survival of all life forms on the planet. However, recent times have witnessed enormous escalation in urban pollution levels. It is therefore, incumbent upon us to decipher measures to deal with it. In perspective, the present study was carried out to assess PM<sub>10</sub> and PM<sub>2.5</sub> loading, metallic constituents, gaseous pollutants, source contributions, health impact and noise level of nine-locations, grouped as residential, commercial, and industrial in Lucknow city for 2019-21. Mean concentrations during pre-monsoon for PM<sub>10</sub>, PM<sub>2.5</sub>, SO<sub>2</sub> and NO<sub>2</sub> were: 138.2 ± 35.2, 69.1 ± 13.6, 8.5 ± 3.3 and 32.3 ± 7.4 µg/m<sup>3</sup>, respectively, whereas post-monsoon concentrations were 143.0 ± 33.3, 74.6 ± 14.5, 12.5 ± 2.1, and 35.5 ± 6.3 µg/m<sup>3</sup>, respectively. Exceedance percentage of pre-monsoon PM<sub>10</sub> over National Ambient Air Quality Standards (NAAQS) was 38.2% while that for post-monsoon was 43.0%; whereas corresponding values for PM<sub>2.5</sub> were 15.2% and 24.3%. Post-monsoon season showed higher particulate loading owing to wintertime inversion and high humidity conditions. Order of elements associated with PM<sub>2.5</sub> is Co < Cd < Cr < Ni < V < Be < Mo < Mn < Ti < Cu < Pb < Se < Sr < Li < B < As < Ba < Mg < Al < Zn < Ca < Fe < K < Na and that with PM<sub>10</sub> is Co < Cd < Ni < Cr < V < Ti < Be < Mo < Cu < Pb < Se < Sr < Li < B < As < Mn < Ba < Mg < Al < Fe < Zn < K < Na < Ca. WHO AIRQ + ascertained 1654, 144 and 1100 attributable cases per 0.1 million of population to PM<sub>10</sub> exposure in 2019-21. Source apportionment was carried out using USEPA-PMF and resolved 6 sources with highest percent contributions including road dust re-entrainment, biomass burning and vehicular emission. It is observed that residents of Lucknow city regularly face exposure to particulate pollutants and associated constituents making it imperative to develop pollution abetment strategies.</p>","PeriodicalId":544,"journal":{"name":"Environmental Monitoring and Assessment","volume":"196 8","pages":"693"},"PeriodicalIF":3.0000,"publicationDate":"2024-07-04","publicationTypes":"Journal Article","fieldsOfStudy":null,"isOpenAccess":false,"openAccessPdf":"","citationCount":"0","resultStr":"{\"title\":\"Spatio-temporal distribution and source contributions of the ambient pollutants in Lucknow city, India.\",\"authors\":\"Priya Saxena, Ankit Kumar, Mohd Muzammil, Sreekanth Bojjagani, Devendra Kumar Patel, Alka Kumari, Altaf Husain Khan, Ganesh Chandra Kisku\",\"doi\":\"10.1007/s10661-024-12832-7\",\"DOIUrl\":null,\"url\":null,\"abstract\":\"<p><p>Clean air is imperative to the survival of all life forms on the planet. However, recent times have witnessed enormous escalation in urban pollution levels. It is therefore, incumbent upon us to decipher measures to deal with it. In perspective, the present study was carried out to assess PM<sub>10</sub> and PM<sub>2.5</sub> loading, metallic constituents, gaseous pollutants, source contributions, health impact and noise level of nine-locations, grouped as residential, commercial, and industrial in Lucknow city for 2019-21. Mean concentrations during pre-monsoon for PM<sub>10</sub>, PM<sub>2.5</sub>, SO<sub>2</sub> and NO<sub>2</sub> were: 138.2 ± 35.2, 69.1 ± 13.6, 8.5 ± 3.3 and 32.3 ± 7.4 µg/m<sup>3</sup>, respectively, whereas post-monsoon concentrations were 143.0 ± 33.3, 74.6 ± 14.5, 12.5 ± 2.1, and 35.5 ± 6.3 µg/m<sup>3</sup>, respectively. Exceedance percentage of pre-monsoon PM<sub>10</sub> over National Ambient Air Quality Standards (NAAQS) was 38.2% while that for post-monsoon was 43.0%; whereas corresponding values for PM<sub>2.5</sub> were 15.2% and 24.3%. Post-monsoon season showed higher particulate loading owing to wintertime inversion and high humidity conditions. Order of elements associated with PM<sub>2.5</sub> is Co < Cd < Cr < Ni < V < Be < Mo < Mn < Ti < Cu < Pb < Se < Sr < Li < B < As < Ba < Mg < Al < Zn < Ca < Fe < K < Na and that with PM<sub>10</sub> is Co < Cd < Ni < Cr < V < Ti < Be < Mo < Cu < Pb < Se < Sr < Li < B < As < Mn < Ba < Mg < Al < Fe < Zn < K < Na < Ca. WHO AIRQ + ascertained 1654, 144 and 1100 attributable cases per 0.1 million of population to PM<sub>10</sub> exposure in 2019-21. Source apportionment was carried out using USEPA-PMF and resolved 6 sources with highest percent contributions including road dust re-entrainment, biomass burning and vehicular emission. It is observed that residents of Lucknow city regularly face exposure to particulate pollutants and associated constituents making it imperative to develop pollution abetment strategies.</p>\",\"PeriodicalId\":544,\"journal\":{\"name\":\"Environmental Monitoring and Assessment\",\"volume\":\"196 8\",\"pages\":\"693\"},\"PeriodicalIF\":3.0000,\"publicationDate\":\"2024-07-04\",\"publicationTypes\":\"Journal Article\",\"fieldsOfStudy\":null,\"isOpenAccess\":false,\"openAccessPdf\":\"\",\"citationCount\":\"0\",\"resultStr\":null,\"platform\":\"Semanticscholar\",\"paperid\":null,\"PeriodicalName\":\"Environmental Monitoring and Assessment\",\"FirstCategoryId\":\"93\",\"ListUrlMain\":\"https://doi.org/10.1007/s10661-024-12832-7\",\"RegionNum\":4,\"RegionCategory\":\"环境科学与生态学\",\"ArticlePicture\":[],\"TitleCN\":null,\"AbstractTextCN\":null,\"PMCID\":null,\"EPubDate\":\"\",\"PubModel\":\"\",\"JCR\":\"Q3\",\"JCRName\":\"ENVIRONMENTAL SCIENCES\",\"Score\":null,\"Total\":0}","platform":"Semanticscholar","paperid":null,"PeriodicalName":"Environmental Monitoring and Assessment","FirstCategoryId":"93","ListUrlMain":"https://doi.org/10.1007/s10661-024-12832-7","RegionNum":4,"RegionCategory":"环境科学与生态学","ArticlePicture":[],"TitleCN":null,"AbstractTextCN":null,"PMCID":null,"EPubDate":"","PubModel":"","JCR":"Q3","JCRName":"ENVIRONMENTAL SCIENCES","Score":null,"Total":0}
Spatio-temporal distribution and source contributions of the ambient pollutants in Lucknow city, India.
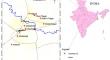
Clean air is imperative to the survival of all life forms on the planet. However, recent times have witnessed enormous escalation in urban pollution levels. It is therefore, incumbent upon us to decipher measures to deal with it. In perspective, the present study was carried out to assess PM10 and PM2.5 loading, metallic constituents, gaseous pollutants, source contributions, health impact and noise level of nine-locations, grouped as residential, commercial, and industrial in Lucknow city for 2019-21. Mean concentrations during pre-monsoon for PM10, PM2.5, SO2 and NO2 were: 138.2 ± 35.2, 69.1 ± 13.6, 8.5 ± 3.3 and 32.3 ± 7.4 µg/m3, respectively, whereas post-monsoon concentrations were 143.0 ± 33.3, 74.6 ± 14.5, 12.5 ± 2.1, and 35.5 ± 6.3 µg/m3, respectively. Exceedance percentage of pre-monsoon PM10 over National Ambient Air Quality Standards (NAAQS) was 38.2% while that for post-monsoon was 43.0%; whereas corresponding values for PM2.5 were 15.2% and 24.3%. Post-monsoon season showed higher particulate loading owing to wintertime inversion and high humidity conditions. Order of elements associated with PM2.5 is Co < Cd < Cr < Ni < V < Be < Mo < Mn < Ti < Cu < Pb < Se < Sr < Li < B < As < Ba < Mg < Al < Zn < Ca < Fe < K < Na and that with PM10 is Co < Cd < Ni < Cr < V < Ti < Be < Mo < Cu < Pb < Se < Sr < Li < B < As < Mn < Ba < Mg < Al < Fe < Zn < K < Na < Ca. WHO AIRQ + ascertained 1654, 144 and 1100 attributable cases per 0.1 million of population to PM10 exposure in 2019-21. Source apportionment was carried out using USEPA-PMF and resolved 6 sources with highest percent contributions including road dust re-entrainment, biomass burning and vehicular emission. It is observed that residents of Lucknow city regularly face exposure to particulate pollutants and associated constituents making it imperative to develop pollution abetment strategies.
期刊介绍:
Environmental Monitoring and Assessment emphasizes technical developments and data arising from environmental monitoring and assessment, the use of scientific principles in the design of monitoring systems at the local, regional and global scales, and the use of monitoring data in assessing the consequences of natural resource management actions and pollution risks to man and the environment.


 分享
分享
 求助内容:
求助内容: 应助结果提醒方式:
 扫码关注我们
