Gabriel J Sanders, Stacie Skodinski, Damjana V Cabarkapa, Mason Howard, Dimitrije Cabarkapa, Corey A Peacock
{"title":"在16周的一级排球赛季中,跳跃负荷、力和速度指标的位置差异。","authors":"Gabriel J Sanders, Stacie Skodinski, Damjana V Cabarkapa, Mason Howard, Dimitrije Cabarkapa, Corey A Peacock","doi":"10.1155/tsm2/5933923","DOIUrl":null,"url":null,"abstract":"<p><p>The study quantified total and high-intensity jump counts and assessed neuromuscular performance through countermovement jump (CMJ) force and velocity metrics by position. Twelve Division I female athletes (19.6 ± 1.3 years; 182.7 ± 6.5 cm) were included in the 16-week study using wearable microsensors to monitor daily jump loads. CMJ tests were conducted twice weekly using dual force plates to measure force and velocity metrics. There were significant main effects of position (<i>p</i> ≤ 0.001) for jump and force plate metrics. Middle blockers accumulated significantly more jump counts of 38.1 cm or higher (jumps 38+; 65.4 ± 39.2 counts) and jump counts of 50.8 cm or higher (jumps 50+; 39.5 ± 32.7 counts) compared to outside hitters (jumps 38+; 39.4 ± 25.9 counts and jumps 50+; 15.0 ± 15.6 counts) and opposite hitters (jumps 38+; 47.9 ± 24.1 counts and jumps 50+; 29.7 ± 18.1 counts), while setters had the fewest high-intensity jump counts (jumps 38+; 19.0 ± 16.6 counts and jumps 50+; 0.4 ± 0.8 counts). Middle blockers had the highest CMJ height (36.1 ± 6.4 cm), deepest CMJ depth (-41.7 ± 6.4 cm) and peak (2.75 ± 0.22 m/s) and average (1.49 ± 0.08 m/s) propulsion velocities (2.75 ± 0.22 m/s). Meanwhile, setters had significantly greater braking RFD (7839 ± 2617 N), average (1698 ± 223 N) and peak braking force (2061 ± 248 N), and average (1446 ± 88 N) and peak propulsion force (1994 ± 213 N), compared to all other positions. Opposite and outside hitters' data fell between setters and middle blockers. Regardless of position, neuromuscular performance fluctuates during the season and there are noticeable positional differences in jump loads and force and velocity metrics.</p>","PeriodicalId":75247,"journal":{"name":"Translational sports medicine","volume":"2024 ","pages":"5933923"},"PeriodicalIF":1.9000,"publicationDate":"2024-12-18","publicationTypes":"Journal Article","fieldsOfStudy":null,"isOpenAccess":false,"openAccessPdf":"https://www.ncbi.nlm.nih.gov/pmc/articles/PMC11669427/pdf/","citationCount":"0","resultStr":"{\"title\":\"Positional Differences in Jump Loads and Force and Velocity Metrics Throughout a 16-Week Division I Volleyball Season.\",\"authors\":\"Gabriel J Sanders, Stacie Skodinski, Damjana V Cabarkapa, Mason Howard, Dimitrije Cabarkapa, Corey A Peacock\",\"doi\":\"10.1155/tsm2/5933923\",\"DOIUrl\":null,\"url\":null,\"abstract\":\"<p><p>The study quantified total and high-intensity jump counts and assessed neuromuscular performance through countermovement jump (CMJ) force and velocity metrics by position. Twelve Division I female athletes (19.6 ± 1.3 years; 182.7 ± 6.5 cm) were included in the 16-week study using wearable microsensors to monitor daily jump loads. CMJ tests were conducted twice weekly using dual force plates to measure force and velocity metrics. There were significant main effects of position (<i>p</i> ≤ 0.001) for jump and force plate metrics. Middle blockers accumulated significantly more jump counts of 38.1 cm or higher (jumps 38+; 65.4 ± 39.2 counts) and jump counts of 50.8 cm or higher (jumps 50+; 39.5 ± 32.7 counts) compared to outside hitters (jumps 38+; 39.4 ± 25.9 counts and jumps 50+; 15.0 ± 15.6 counts) and opposite hitters (jumps 38+; 47.9 ± 24.1 counts and jumps 50+; 29.7 ± 18.1 counts), while setters had the fewest high-intensity jump counts (jumps 38+; 19.0 ± 16.6 counts and jumps 50+; 0.4 ± 0.8 counts). Middle blockers had the highest CMJ height (36.1 ± 6.4 cm), deepest CMJ depth (-41.7 ± 6.4 cm) and peak (2.75 ± 0.22 m/s) and average (1.49 ± 0.08 m/s) propulsion velocities (2.75 ± 0.22 m/s). Meanwhile, setters had significantly greater braking RFD (7839 ± 2617 N), average (1698 ± 223 N) and peak braking force (2061 ± 248 N), and average (1446 ± 88 N) and peak propulsion force (1994 ± 213 N), compared to all other positions. Opposite and outside hitters' data fell between setters and middle blockers. Regardless of position, neuromuscular performance fluctuates during the season and there are noticeable positional differences in jump loads and force and velocity metrics.</p>\",\"PeriodicalId\":75247,\"journal\":{\"name\":\"Translational sports medicine\",\"volume\":\"2024 \",\"pages\":\"5933923\"},\"PeriodicalIF\":1.9000,\"publicationDate\":\"2024-12-18\",\"publicationTypes\":\"Journal Article\",\"fieldsOfStudy\":null,\"isOpenAccess\":false,\"openAccessPdf\":\"https://www.ncbi.nlm.nih.gov/pmc/articles/PMC11669427/pdf/\",\"citationCount\":\"0\",\"resultStr\":null,\"platform\":\"Semanticscholar\",\"paperid\":null,\"PeriodicalName\":\"Translational sports medicine\",\"FirstCategoryId\":\"1085\",\"ListUrlMain\":\"https://doi.org/10.1155/tsm2/5933923\",\"RegionNum\":0,\"RegionCategory\":null,\"ArticlePicture\":[],\"TitleCN\":null,\"AbstractTextCN\":null,\"PMCID\":null,\"EPubDate\":\"2024/1/1 0:00:00\",\"PubModel\":\"eCollection\",\"JCR\":\"Q3\",\"JCRName\":\"SPORT SCIENCES\",\"Score\":null,\"Total\":0}","platform":"Semanticscholar","paperid":null,"PeriodicalName":"Translational sports medicine","FirstCategoryId":"1085","ListUrlMain":"https://doi.org/10.1155/tsm2/5933923","RegionNum":0,"RegionCategory":null,"ArticlePicture":[],"TitleCN":null,"AbstractTextCN":null,"PMCID":null,"EPubDate":"2024/1/1 0:00:00","PubModel":"eCollection","JCR":"Q3","JCRName":"SPORT SCIENCES","Score":null,"Total":0}
Positional Differences in Jump Loads and Force and Velocity Metrics Throughout a 16-Week Division I Volleyball Season.
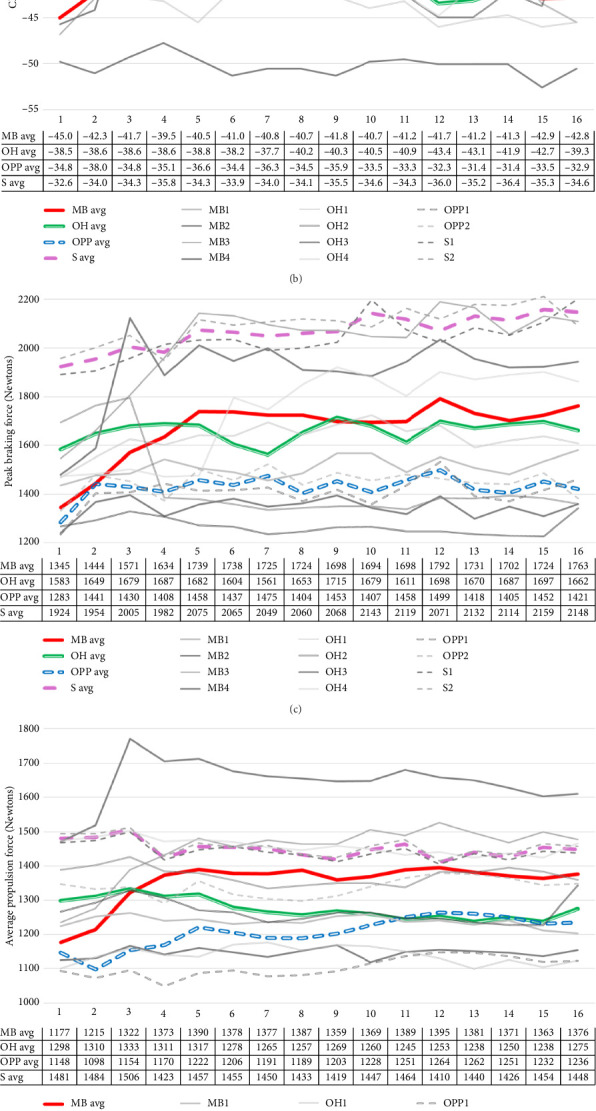
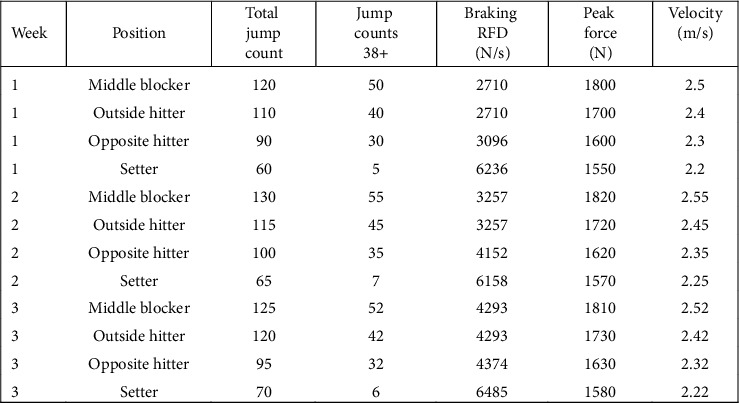
The study quantified total and high-intensity jump counts and assessed neuromuscular performance through countermovement jump (CMJ) force and velocity metrics by position. Twelve Division I female athletes (19.6 ± 1.3 years; 182.7 ± 6.5 cm) were included in the 16-week study using wearable microsensors to monitor daily jump loads. CMJ tests were conducted twice weekly using dual force plates to measure force and velocity metrics. There were significant main effects of position (p ≤ 0.001) for jump and force plate metrics. Middle blockers accumulated significantly more jump counts of 38.1 cm or higher (jumps 38+; 65.4 ± 39.2 counts) and jump counts of 50.8 cm or higher (jumps 50+; 39.5 ± 32.7 counts) compared to outside hitters (jumps 38+; 39.4 ± 25.9 counts and jumps 50+; 15.0 ± 15.6 counts) and opposite hitters (jumps 38+; 47.9 ± 24.1 counts and jumps 50+; 29.7 ± 18.1 counts), while setters had the fewest high-intensity jump counts (jumps 38+; 19.0 ± 16.6 counts and jumps 50+; 0.4 ± 0.8 counts). Middle blockers had the highest CMJ height (36.1 ± 6.4 cm), deepest CMJ depth (-41.7 ± 6.4 cm) and peak (2.75 ± 0.22 m/s) and average (1.49 ± 0.08 m/s) propulsion velocities (2.75 ± 0.22 m/s). Meanwhile, setters had significantly greater braking RFD (7839 ± 2617 N), average (1698 ± 223 N) and peak braking force (2061 ± 248 N), and average (1446 ± 88 N) and peak propulsion force (1994 ± 213 N), compared to all other positions. Opposite and outside hitters' data fell between setters and middle blockers. Regardless of position, neuromuscular performance fluctuates during the season and there are noticeable positional differences in jump loads and force and velocity metrics.


 分享
分享

 求助内容:
求助内容: 应助结果提醒方式:
 扫码关注我们
