{"title":"为设计量身定制的患者报告结果信息图准备探索数据属性的系统方法。","authors":"Adriana Arcia, Janet Woollen, Suzanne Bakken","doi":"10.5334/egems.190","DOIUrl":null,"url":null,"abstract":"<p><strong>Context: </strong>Tailored visualizations of patient reported outcomes (PROs) are valuable health communication tools to support shared decision making, health self-management, and engagement with research participants, such as cohorts in the NIH Precision Medicine Initiative. The automation of visualizations presents some unique design challenges. Efficient design processes depend upon gaining a thorough understanding of the data prior to prototyping.</p><p><strong>Case description: </strong>We present a systematic method to exploring data attributes, with a specific focus on application to self-reported health data. The method entails a) determining the meaning of the variable to be visualized, b) identifying the possible and likely values, and c) understanding how values are interpreted.</p><p><strong>Findings: </strong>We present two case studies to illustrate how this method affected our design decisions particularly with respect to outlier and non-missing zero values.</p><p><strong>Major themes: </strong>The use of a systematic method made our process of exploring data attributes easily manageable. The limitations of the data can narrow design options but can also prompt creative solutions and innovative design opportunities.</p><p><strong>Conclusion: </strong>A systematic method of exploration of data contributes to an efficient design process, uncovers design opportunities, and alerts the designer to design challenges.</p>","PeriodicalId":72880,"journal":{"name":"EGEMS (Washington, DC)","volume":" ","pages":"2"},"PeriodicalIF":0.0000,"publicationDate":"2018-01-24","publicationTypes":"Journal Article","fieldsOfStudy":null,"isOpenAccess":false,"openAccessPdf":"https://www.ncbi.nlm.nih.gov/pmc/articles/PMC5983055/pdf/","citationCount":"14","resultStr":"{\"title\":\"A Systematic Method for Exploring Data Attributes in Preparation for Designing Tailored Infographics of Patient Reported Outcomes.\",\"authors\":\"Adriana Arcia, Janet Woollen, Suzanne Bakken\",\"doi\":\"10.5334/egems.190\",\"DOIUrl\":null,\"url\":null,\"abstract\":\"<p><strong>Context: </strong>Tailored visualizations of patient reported outcomes (PROs) are valuable health communication tools to support shared decision making, health self-management, and engagement with research participants, such as cohorts in the NIH Precision Medicine Initiative. The automation of visualizations presents some unique design challenges. Efficient design processes depend upon gaining a thorough understanding of the data prior to prototyping.</p><p><strong>Case description: </strong>We present a systematic method to exploring data attributes, with a specific focus on application to self-reported health data. The method entails a) determining the meaning of the variable to be visualized, b) identifying the possible and likely values, and c) understanding how values are interpreted.</p><p><strong>Findings: </strong>We present two case studies to illustrate how this method affected our design decisions particularly with respect to outlier and non-missing zero values.</p><p><strong>Major themes: </strong>The use of a systematic method made our process of exploring data attributes easily manageable. The limitations of the data can narrow design options but can also prompt creative solutions and innovative design opportunities.</p><p><strong>Conclusion: </strong>A systematic method of exploration of data contributes to an efficient design process, uncovers design opportunities, and alerts the designer to design challenges.</p>\",\"PeriodicalId\":72880,\"journal\":{\"name\":\"EGEMS (Washington, DC)\",\"volume\":\" \",\"pages\":\"2\"},\"PeriodicalIF\":0.0000,\"publicationDate\":\"2018-01-24\",\"publicationTypes\":\"Journal Article\",\"fieldsOfStudy\":null,\"isOpenAccess\":false,\"openAccessPdf\":\"https://www.ncbi.nlm.nih.gov/pmc/articles/PMC5983055/pdf/\",\"citationCount\":\"14\",\"resultStr\":null,\"platform\":\"Semanticscholar\",\"paperid\":null,\"PeriodicalName\":\"EGEMS (Washington, DC)\",\"FirstCategoryId\":\"1085\",\"ListUrlMain\":\"https://doi.org/10.5334/egems.190\",\"RegionNum\":0,\"RegionCategory\":null,\"ArticlePicture\":[],\"TitleCN\":null,\"AbstractTextCN\":null,\"PMCID\":null,\"EPubDate\":\"\",\"PubModel\":\"\",\"JCR\":\"\",\"JCRName\":\"\",\"Score\":null,\"Total\":0}","platform":"Semanticscholar","paperid":null,"PeriodicalName":"EGEMS (Washington, DC)","FirstCategoryId":"1085","ListUrlMain":"https://doi.org/10.5334/egems.190","RegionNum":0,"RegionCategory":null,"ArticlePicture":[],"TitleCN":null,"AbstractTextCN":null,"PMCID":null,"EPubDate":"","PubModel":"","JCR":"","JCRName":"","Score":null,"Total":0}
A Systematic Method for Exploring Data Attributes in Preparation for Designing Tailored Infographics of Patient Reported Outcomes.
Context: Tailored visualizations of patient reported outcomes (PROs) are valuable health communication tools to support shared decision making, health self-management, and engagement with research participants, such as cohorts in the NIH Precision Medicine Initiative. The automation of visualizations presents some unique design challenges. Efficient design processes depend upon gaining a thorough understanding of the data prior to prototyping.
Case description: We present a systematic method to exploring data attributes, with a specific focus on application to self-reported health data. The method entails a) determining the meaning of the variable to be visualized, b) identifying the possible and likely values, and c) understanding how values are interpreted.
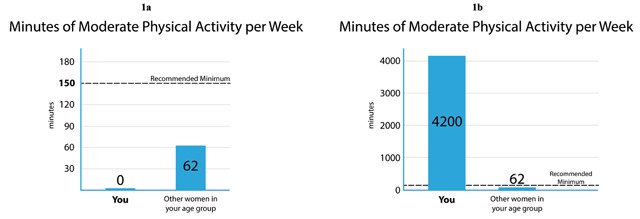
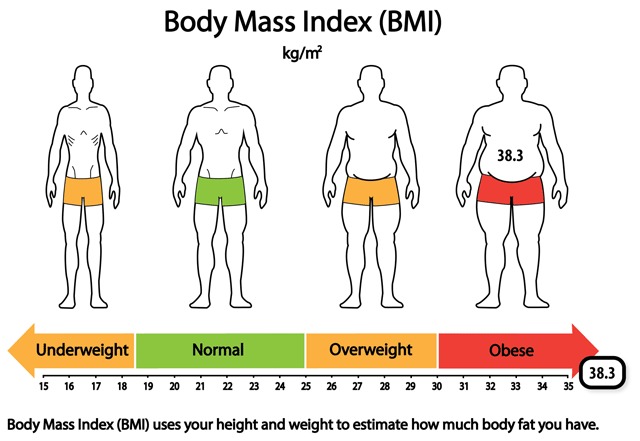
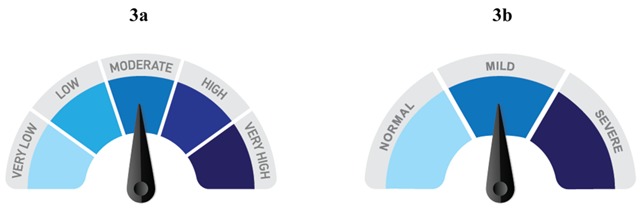
Findings: We present two case studies to illustrate how this method affected our design decisions particularly with respect to outlier and non-missing zero values.
Major themes: The use of a systematic method made our process of exploring data attributes easily manageable. The limitations of the data can narrow design options but can also prompt creative solutions and innovative design opportunities.
Conclusion: A systematic method of exploration of data contributes to an efficient design process, uncovers design opportunities, and alerts the designer to design challenges.


 分享
分享

 求助内容:
求助内容: 应助结果提醒方式:
 扫码关注我们
