{"title":"发布信息TOC","authors":"","doi":"10.1002/cphg.76","DOIUrl":null,"url":null,"abstract":"<p><b>Cover</b>: In Rasooly and Patel (https://doi.org/10.1002/cphg.82), the image shows the scatterplot suggests a positive causal relationship of the SNP effects on BMI against the SNP effects on type 2 diabetes. Each point represents a single genetic variant. The horizontal and vertical lines extending from each point represent 95% confidence intervals for the genetic associations. The x-axis displays the estimated genetic associations with the exposure (BMI), and the y-axis displays the estimated genetic associations with the outcome (type 2 diabetes). The color of the lines indicate the type of MR test used (light blue for IVW, dark blue for MR Egger, light green for simple mode, dark green for weighted median, and red for weighted mode).\n\n <figure>\n <div><picture>\n <source></source></picture><p></p>\n </div>\n </figure></p>","PeriodicalId":40007,"journal":{"name":"Current Protocols in Human Genetics","volume":"101 1","pages":""},"PeriodicalIF":0.0000,"publicationDate":"2019-03-19","publicationTypes":"Journal Article","fieldsOfStudy":null,"isOpenAccess":false,"openAccessPdf":"https://sci-hub-pdf.com/10.1002/cphg.76","citationCount":"0","resultStr":"{\"title\":\"Issue Information TOC\",\"authors\":\"\",\"doi\":\"10.1002/cphg.76\",\"DOIUrl\":null,\"url\":null,\"abstract\":\"<p><b>Cover</b>: In Rasooly and Patel (https://doi.org/10.1002/cphg.82), the image shows the scatterplot suggests a positive causal relationship of the SNP effects on BMI against the SNP effects on type 2 diabetes. Each point represents a single genetic variant. The horizontal and vertical lines extending from each point represent 95% confidence intervals for the genetic associations. The x-axis displays the estimated genetic associations with the exposure (BMI), and the y-axis displays the estimated genetic associations with the outcome (type 2 diabetes). The color of the lines indicate the type of MR test used (light blue for IVW, dark blue for MR Egger, light green for simple mode, dark green for weighted median, and red for weighted mode).\\n\\n <figure>\\n <div><picture>\\n <source></source></picture><p></p>\\n </div>\\n </figure></p>\",\"PeriodicalId\":40007,\"journal\":{\"name\":\"Current Protocols in Human Genetics\",\"volume\":\"101 1\",\"pages\":\"\"},\"PeriodicalIF\":0.0000,\"publicationDate\":\"2019-03-19\",\"publicationTypes\":\"Journal Article\",\"fieldsOfStudy\":null,\"isOpenAccess\":false,\"openAccessPdf\":\"https://sci-hub-pdf.com/10.1002/cphg.76\",\"citationCount\":\"0\",\"resultStr\":null,\"platform\":\"Semanticscholar\",\"paperid\":null,\"PeriodicalName\":\"Current Protocols in Human Genetics\",\"FirstCategoryId\":\"1085\",\"ListUrlMain\":\"https://onlinelibrary.wiley.com/doi/10.1002/cphg.76\",\"RegionNum\":0,\"RegionCategory\":null,\"ArticlePicture\":[],\"TitleCN\":null,\"AbstractTextCN\":null,\"PMCID\":null,\"EPubDate\":\"\",\"PubModel\":\"\",\"JCR\":\"\",\"JCRName\":\"\",\"Score\":null,\"Total\":0}","platform":"Semanticscholar","paperid":null,"PeriodicalName":"Current Protocols in Human Genetics","FirstCategoryId":"1085","ListUrlMain":"https://onlinelibrary.wiley.com/doi/10.1002/cphg.76","RegionNum":0,"RegionCategory":null,"ArticlePicture":[],"TitleCN":null,"AbstractTextCN":null,"PMCID":null,"EPubDate":"","PubModel":"","JCR":"","JCRName":"","Score":null,"Total":0}
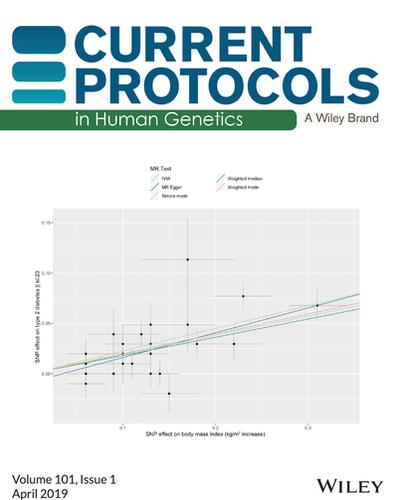
Cover: In Rasooly and Patel (https://doi.org/10.1002/cphg.82), the image shows the scatterplot suggests a positive causal relationship of the SNP effects on BMI against the SNP effects on type 2 diabetes. Each point represents a single genetic variant. The horizontal and vertical lines extending from each point represent 95% confidence intervals for the genetic associations. The x-axis displays the estimated genetic associations with the exposure (BMI), and the y-axis displays the estimated genetic associations with the outcome (type 2 diabetes). The color of the lines indicate the type of MR test used (light blue for IVW, dark blue for MR Egger, light green for simple mode, dark green for weighted median, and red for weighted mode).


 分享
分享
 求助内容:
求助内容: 应助结果提醒方式:
 扫码关注我们
