{"title":"An integration of geospatial and fuzzy-logic techniques for flood-hazard mapping","authors":"Mausmi Gohil, Darshan Mehta, Mohamedmaroof Shaikh","doi":"10.1007/s12040-024-02288-1","DOIUrl":null,"url":null,"abstract":"<p>A hazard is a natural occurrence that might harm humans, animals or the environment. It may cause loss of life, illness or other health consequences, property damage, social and economic crisis or environmental degradation. Various regions around the world are vulnerable to one or more types of disasters. Flooding is one of the worst environmental catastrophes that impacts both civilisation and the environment globally. Various datasets and methods, such as meteorological data, satellite images and GIS, were used to create the hazard assessment map. For a particular region, flood hazards can be developed by integrating an assessment map for several parameter categories. The aim of the study was to evaluate the hazard of flooding and map the areas that will be flooded in Gujarat. This study develops and tests flood-hazard maps to visualise the spatial variation of hazards in Gujarat, India. The parameters for flood-hazard assessment are mainly considered as elevation, slope, aspect, curvature, lithology, soil, land use/cover, drainage density and distance from the river, and rainfall to create a map in the context of a GIS. The acquired data was evaluated using ArcGIS and fuzzy-logic techniques to build a flood hazard map. Five categories have been assigned to the computed flood hazard map: very low, low, moderate, high, and very high. Engineers, planners and local governments may find this study useful in the future when it comes to land use planning and the control of hazards. Flood hazard potential mapping is necessary to manage and mitigate flooding.</p>","PeriodicalId":15609,"journal":{"name":"Journal of Earth System Science","volume":"50 1","pages":""},"PeriodicalIF":1.7000,"publicationDate":"2024-04-10","publicationTypes":"Journal Article","fieldsOfStudy":null,"isOpenAccess":false,"openAccessPdf":"","citationCount":"0","resultStr":null,"platform":"Semanticscholar","paperid":null,"PeriodicalName":"Journal of Earth System Science","FirstCategoryId":"89","ListUrlMain":"https://doi.org/10.1007/s12040-024-02288-1","RegionNum":4,"RegionCategory":"地球科学","ArticlePicture":[],"TitleCN":null,"AbstractTextCN":null,"PMCID":null,"EPubDate":"","PubModel":"","JCR":"Q3","JCRName":"GEOSCIENCES, MULTIDISCIPLINARY","Score":null,"Total":0}
引用次数: 0
Abstract
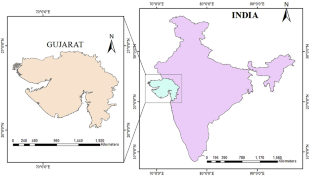
A hazard is a natural occurrence that might harm humans, animals or the environment. It may cause loss of life, illness or other health consequences, property damage, social and economic crisis or environmental degradation. Various regions around the world are vulnerable to one or more types of disasters. Flooding is one of the worst environmental catastrophes that impacts both civilisation and the environment globally. Various datasets and methods, such as meteorological data, satellite images and GIS, were used to create the hazard assessment map. For a particular region, flood hazards can be developed by integrating an assessment map for several parameter categories. The aim of the study was to evaluate the hazard of flooding and map the areas that will be flooded in Gujarat. This study develops and tests flood-hazard maps to visualise the spatial variation of hazards in Gujarat, India. The parameters for flood-hazard assessment are mainly considered as elevation, slope, aspect, curvature, lithology, soil, land use/cover, drainage density and distance from the river, and rainfall to create a map in the context of a GIS. The acquired data was evaluated using ArcGIS and fuzzy-logic techniques to build a flood hazard map. Five categories have been assigned to the computed flood hazard map: very low, low, moderate, high, and very high. Engineers, planners and local governments may find this study useful in the future when it comes to land use planning and the control of hazards. Flood hazard potential mapping is necessary to manage and mitigate flooding.
期刊介绍:
The Journal of Earth System Science, an International Journal, was earlier a part of the Proceedings of the Indian Academy of Sciences – Section A begun in 1934, and later split in 1978 into theme journals. This journal was published as Proceedings – Earth and Planetary Sciences since 1978, and in 2005 was renamed ‘Journal of Earth System Science’.
The journal is highly inter-disciplinary and publishes scholarly research – new data, ideas, and conceptual advances – in Earth System Science. The focus is on the evolution of the Earth as a system: manuscripts describing changes of anthropogenic origin in a limited region are not considered unless they go beyond describing the changes to include an analysis of earth-system processes. The journal''s scope includes the solid earth (geosphere), the atmosphere, the hydrosphere (including cryosphere), and the biosphere; it also addresses related aspects of planetary and space sciences. Contributions pertaining to the Indian sub- continent and the surrounding Indian-Ocean region are particularly welcome. Given that a large number of manuscripts report either observations or model results for a limited domain, manuscripts intended for publication in JESS are expected to fulfill at least one of the following three criteria.
The data should be of relevance and should be of statistically significant size and from a region from where such data are sparse. If the data are from a well-sampled region, the data size should be considerable and advance our knowledge of the region.
A model study is carried out to explain observations reported either in the same manuscript or in the literature.
The analysis, whether of data or with models, is novel and the inferences advance the current knowledge.


 分享
分享
 求助内容:
求助内容: 应助结果提醒方式:
 扫码关注我们
