Merve Yılmaz, Yiğitalp Kara, Hüseyin Toros, Selahattin İncecik
{"title":"Analysis of the summer thermal comfort indices in İstanbul","authors":"Merve Yılmaz, Yiğitalp Kara, Hüseyin Toros, Selahattin İncecik","doi":"10.1007/s00484-024-02669-7","DOIUrl":null,"url":null,"abstract":"<div><p>Thermal indices and thermal comfort maps have great importance in developing health-minded climate action strategies and livable urban layouts. Especially in cities where vulnerability to heatwaves is high, it is necessary to detect the most appropriate indicators for the regional characteristics and action planning with respect to thermal comfort. The aim of the study is to examine thermal indices as indicators of regional climate characteristics by relating to meteorological parameters and spatial features. Atmospheric variables including air temperature, wind speed, cloud cover, and relative humidity data were obtained from 30 meteorological stations located in districts having different climatic features. Heat stress levels for apparent temperature (AT), heat index (HI), wet bulb globe temperature (WBGT), physiological equivalent temperature (PET), universal thermal climate index (UTCI), and perceived temperature (PT) indices were calculated and associated with meteorological parameters. Thermal comfort maps have been created with the daily mean and maximum values of all indices. As a result, the meteorological parameters with the strongest correlation with all thermal indices are air temperature (T<sub>a</sub>) with <i>r</i> = 0.89 ± 0.01 and mean radiant temperature (T<sub>mrt</sub>) with <i>r</i> = 0.75 ± 0.16. The differences in thermal stress levels over the city have been distinctively observed in the AT<sub>max</sub>, PET<sub>max</sub>, and PT<sub>max</sub> maps, which are generated by the daily maximum values of the indices. Çatalca, where forests cover large areas compared to highly urbanized districts, has the lowest heat stress defined by all indices.</p></div>","PeriodicalId":588,"journal":{"name":"International Journal of Biometeorology","volume":"68 7","pages":"1327 - 1342"},"PeriodicalIF":2.6000,"publicationDate":"2024-04-24","publicationTypes":"Journal Article","fieldsOfStudy":null,"isOpenAccess":false,"openAccessPdf":"https://link.springer.com/content/pdf/10.1007/s00484-024-02669-7.pdf","citationCount":"0","resultStr":null,"platform":"Semanticscholar","paperid":null,"PeriodicalName":"International Journal of Biometeorology","FirstCategoryId":"89","ListUrlMain":"https://link.springer.com/article/10.1007/s00484-024-02669-7","RegionNum":3,"RegionCategory":"地球科学","ArticlePicture":[],"TitleCN":null,"AbstractTextCN":null,"PMCID":null,"EPubDate":"","PubModel":"","JCR":"Q2","JCRName":"BIOPHYSICS","Score":null,"Total":0}
引用次数: 0
Abstract
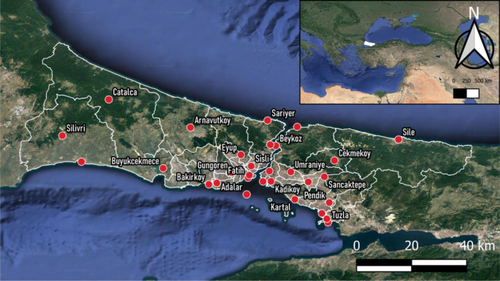
Thermal indices and thermal comfort maps have great importance in developing health-minded climate action strategies and livable urban layouts. Especially in cities where vulnerability to heatwaves is high, it is necessary to detect the most appropriate indicators for the regional characteristics and action planning with respect to thermal comfort. The aim of the study is to examine thermal indices as indicators of regional climate characteristics by relating to meteorological parameters and spatial features. Atmospheric variables including air temperature, wind speed, cloud cover, and relative humidity data were obtained from 30 meteorological stations located in districts having different climatic features. Heat stress levels for apparent temperature (AT), heat index (HI), wet bulb globe temperature (WBGT), physiological equivalent temperature (PET), universal thermal climate index (UTCI), and perceived temperature (PT) indices were calculated and associated with meteorological parameters. Thermal comfort maps have been created with the daily mean and maximum values of all indices. As a result, the meteorological parameters with the strongest correlation with all thermal indices are air temperature (Ta) with r = 0.89 ± 0.01 and mean radiant temperature (Tmrt) with r = 0.75 ± 0.16. The differences in thermal stress levels over the city have been distinctively observed in the ATmax, PETmax, and PTmax maps, which are generated by the daily maximum values of the indices. Çatalca, where forests cover large areas compared to highly urbanized districts, has the lowest heat stress defined by all indices.
期刊介绍:
The Journal publishes original research papers, review articles and short communications on studies examining the interactions between living organisms and factors of the natural and artificial atmospheric environment.
Living organisms extend from single cell organisms, to plants and animals, including humans. The atmospheric environment includes climate and weather, electromagnetic radiation, and chemical and biological pollutants. The journal embraces basic and applied research and practical aspects such as living conditions, agriculture, forestry, and health.
The journal is published for the International Society of Biometeorology, and most membership categories include a subscription to the Journal.


 分享
分享
 求助内容:
求助内容: 应助结果提醒方式:
 扫码关注我们
