Keval H. Jodhani, Nitesh Gupta, Aditya D. Parmar, Jimit D. Bhavsar, Dhruvesh Patel, Sudhir Kumar Singh, Umank Mishra, Padam Jee Omar, Ganesh Ji Omar
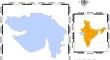
{"title":"Unveiling Seasonal Fluctuations in Air Quality Using Google Earth Engine: A Case Study for Gujarat, India","authors":"Keval H. Jodhani, Nitesh Gupta, Aditya D. Parmar, Jimit D. Bhavsar, Dhruvesh Patel, Sudhir Kumar Singh, Umank Mishra, Padam Jee Omar, Ganesh Ji Omar","doi":"10.1007/s11244-024-01957-1","DOIUrl":null,"url":null,"abstract":"<div><p>Presently, a significant portion of the global population resides in metropolitan areas where air pollution levels are usually high. The primary objective is to utilize satellite data to identify the concentration of pollutants, unlike the traditional method which utilizes a series of ground-based detectors. The study aims to analyze the distribution of different pollutants in the air over the Gujarat state, India. The study comprised the utilization of Sentinel 5-P data sets for mapping Carbon monoxide (CO), Nitrogen dioxide (NO<sub>2</sub>), Sulfur dioxide (SO<sub>2</sub>), Methane (CH<sub>4</sub>), and Formaldehyde (HCHO). Google Earth Engine platform was used for the processing of satellite imagery and maps were prepared using ArcGIS 10.3. The satellite data sets of different pollutants were processed and assessed for three seasons i.e., winter, summer, and monsoon to analyze the effect of climatic conditions as well on the concentration level over the study area. The concentration of CO ranges between 0.0295–0.0401 mol/m<sup>2</sup>. The average concentration of SO<sub>2</sub> is 0.00047 mol/m<sup>2</sup> whereas the average concentration of NO<sub>2</sub> ranges from 0–0.00021 mol/m<sup>2</sup> and formaldehyde concentrations values range from 0.00015 to 0.00026 mol/m<sup>2</sup> over the year. The concentration range for methane is 1780–1940 ppb for the study area. The results exhibit that the northern part of Gujarat mainly consisting of Kutch, Banas Kantha, and Patan renders the lowest concentration of all air pollutants while the central and southern regions consisting of cities like Valsad, Surat, Bharuch, Vadodara, and Ahmedabad have recorded the peak values in all the seasons. The findings suggest that the increase in the levels of different pollutants is caused by human activities, industrialization, and urbanization.</p></div>","PeriodicalId":801,"journal":{"name":"Topics in Catalysis","volume":"67 15-16","pages":"961 - 982"},"PeriodicalIF":3.0000,"publicationDate":"2024-05-15","publicationTypes":"Journal Article","fieldsOfStudy":null,"isOpenAccess":false,"openAccessPdf":"","citationCount":"0","resultStr":null,"platform":"Semanticscholar","paperid":null,"PeriodicalName":"Topics in Catalysis","FirstCategoryId":"92","ListUrlMain":"https://link.springer.com/article/10.1007/s11244-024-01957-1","RegionNum":3,"RegionCategory":"化学","ArticlePicture":[],"TitleCN":null,"AbstractTextCN":null,"PMCID":null,"EPubDate":"","PubModel":"","JCR":"Q2","JCRName":"CHEMISTRY, APPLIED","Score":null,"Total":0}
引用次数: 0
Abstract
Presently, a significant portion of the global population resides in metropolitan areas where air pollution levels are usually high. The primary objective is to utilize satellite data to identify the concentration of pollutants, unlike the traditional method which utilizes a series of ground-based detectors. The study aims to analyze the distribution of different pollutants in the air over the Gujarat state, India. The study comprised the utilization of Sentinel 5-P data sets for mapping Carbon monoxide (CO), Nitrogen dioxide (NO2), Sulfur dioxide (SO2), Methane (CH4), and Formaldehyde (HCHO). Google Earth Engine platform was used for the processing of satellite imagery and maps were prepared using ArcGIS 10.3. The satellite data sets of different pollutants were processed and assessed for three seasons i.e., winter, summer, and monsoon to analyze the effect of climatic conditions as well on the concentration level over the study area. The concentration of CO ranges between 0.0295–0.0401 mol/m2. The average concentration of SO2 is 0.00047 mol/m2 whereas the average concentration of NO2 ranges from 0–0.00021 mol/m2 and formaldehyde concentrations values range from 0.00015 to 0.00026 mol/m2 over the year. The concentration range for methane is 1780–1940 ppb for the study area. The results exhibit that the northern part of Gujarat mainly consisting of Kutch, Banas Kantha, and Patan renders the lowest concentration of all air pollutants while the central and southern regions consisting of cities like Valsad, Surat, Bharuch, Vadodara, and Ahmedabad have recorded the peak values in all the seasons. The findings suggest that the increase in the levels of different pollutants is caused by human activities, industrialization, and urbanization.
期刊介绍:
Topics in Catalysis publishes topical collections in all fields of catalysis which are composed only of invited articles from leading authors. The journal documents today’s emerging and critical trends in all branches of catalysis. Each themed issue is organized by renowned Guest Editors in collaboration with the Editors-in-Chief. Proposals for new topics are welcome and should be submitted directly to the Editors-in-Chief.
The publication of individual uninvited original research articles can be sent to our sister journal Catalysis Letters. This journal aims for rapid publication of high-impact original research articles in all fields of both applied and theoretical catalysis, including heterogeneous, homogeneous and biocatalysis.


 分享
分享
 求助内容:
求助内容: 应助结果提醒方式:
 扫码关注我们
