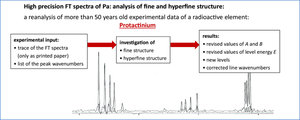
High precision in a Fourier-transform spectrum of protactinium: extensive weighted least-squares fits of peak wavenumbers for analysis of fine and hyperfine structure
{"title":"High precision in a Fourier-transform spectrum of protactinium: extensive weighted least-squares fits of peak wavenumbers for analysis of fine and hyperfine structure","authors":"Sophie Kröger","doi":"10.1140/epjd/s10053-024-00895-7","DOIUrl":null,"url":null,"abstract":"<p>A Fourier-transform recording of protactinium in the infrared range is reanalysed with high precision in order to determine the hyperfine interaction constants <i>A</i> and <i>B</i>. Starting with a selection of best lines and least-squares fits of hyperfine structure intervals, large systems of linear equations compare experimental hyperfine peak wavenumbers with a theoretical representation. The theoretical representation is based on Ritz’s combination principle and Casimir’s formula according to the existing classification. Weighted least-squares fits allow a discrimination between unperturbed and perturbed data such as blended hyperfine structure components. For the first time, the wavenumbers of the hyperfine components of more than 600 lines are fitted using the characteristics of about 250 levels as parameters. When adding adjustable wavenumber-scale correction parameters, global consistency for the whole IR spectrum is obtained with local limits of about <span>\\(0.3\\,\\times 10^{-3}\\)</span> cm<span>\\(^{-1}\\)</span>. This demonstrates the high precision in both recording and analysis. The values of the fine structure energies are revised. Standard errors around 0.1 <span>\\(\\times 10^{-3}\\)</span> cm<span>\\(^{-1}\\)</span> for the <i>A</i> constants and 10<span>\\(^{-3}\\)</span> cm<span>\\(^{-1}\\)</span> for the <i>B</i> constants and the fine structure energies are achieved. Representative examples illustrate extensive results obtained for atomic protactinium. This high precision facilitates further search for new energy levels, and 20 new levels were presented. <b>Foreword</b> The data presented here are the results of a study carried out at the Laboratoire Aimé Cotton (LAC) at Paris-Orsay in the years 2003 and 2004, when I was there for a research stay. At this time, I worked together with Jean-François Wyart and Annie Ginibre on the re-examination of protactinium spectra that have been measured about 30 years earlier and that were available in the form of a printed list of peak wavenumbers and a printed paper chart of the intensity profile. The spectra had already been analysed, but there was still a lot of additional information that could be extracted from the spectra with time and effort. The review of the data, the selection of the data and the step-by-step optimization of the data set took a lot of time. When I returned to Berlin in 2004, we had made good progress, but in principle, it is like a bottomless pit. We continued together to optimize the data and tried to the finishing touches to it. At some point, we decided that we had reached a ‘level of maturity’ where the data could be published. We have discussed a lot about how detailed the text should be. This discussion has dragged on over the years and this project has repeatedly been lost in the stream of other everyday tasks. Every now and then there was a small attempt to return to this topic, but it quickly got lost in the daily hustle and bustle. In 2012, we presented the results at a conference. The death of both of them within two years hit me hard. I very much regret that this work was not published earlier. This special volume was the right motivation for me to finally publish this data. I no longer have access neither to the computer programs used at the time, which ran on large computer systems, nor to the original measurement data. I have not been able to find out what happened to the large quantity of paper (printed list of peak wavenumbers anda printed paper chart of spectra). But I have a bunch of input and output files of the calculations that have become a bit jumbled over the years, which contain a lot of information, as well as our unfinished manuscript. The resulting data contain important information for posterity – particularly since the element is radioactive and the experiments to collect laboratory data are unlikely to be repeated any time soon. I think it is worth publishing these data.</p><p>High precision FT spectra of Pa: analysis of fine and hyperfine structure</p>","PeriodicalId":789,"journal":{"name":"The European Physical Journal D","volume":"78 8","pages":""},"PeriodicalIF":1.5000,"publicationDate":"2024-08-13","publicationTypes":"Journal Article","fieldsOfStudy":null,"isOpenAccess":false,"openAccessPdf":"https://link.springer.com/content/pdf/10.1140/epjd/s10053-024-00895-7.pdf","citationCount":"0","resultStr":null,"platform":"Semanticscholar","paperid":null,"PeriodicalName":"The European Physical Journal D","FirstCategoryId":"4","ListUrlMain":"https://link.springer.com/article/10.1140/epjd/s10053-024-00895-7","RegionNum":4,"RegionCategory":"物理与天体物理","ArticlePicture":[],"TitleCN":null,"AbstractTextCN":null,"PMCID":null,"EPubDate":"","PubModel":"","JCR":"Q3","JCRName":"OPTICS","Score":null,"Total":0}
引用次数: 0
Abstract
A Fourier-transform recording of protactinium in the infrared range is reanalysed with high precision in order to determine the hyperfine interaction constants A and B. Starting with a selection of best lines and least-squares fits of hyperfine structure intervals, large systems of linear equations compare experimental hyperfine peak wavenumbers with a theoretical representation. The theoretical representation is based on Ritz’s combination principle and Casimir’s formula according to the existing classification. Weighted least-squares fits allow a discrimination between unperturbed and perturbed data such as blended hyperfine structure components. For the first time, the wavenumbers of the hyperfine components of more than 600 lines are fitted using the characteristics of about 250 levels as parameters. When adding adjustable wavenumber-scale correction parameters, global consistency for the whole IR spectrum is obtained with local limits of about \(0.3\,\times 10^{-3}\) cm\(^{-1}\). This demonstrates the high precision in both recording and analysis. The values of the fine structure energies are revised. Standard errors around 0.1 \(\times 10^{-3}\) cm\(^{-1}\) for the A constants and 10\(^{-3}\) cm\(^{-1}\) for the B constants and the fine structure energies are achieved. Representative examples illustrate extensive results obtained for atomic protactinium. This high precision facilitates further search for new energy levels, and 20 new levels were presented. Foreword The data presented here are the results of a study carried out at the Laboratoire Aimé Cotton (LAC) at Paris-Orsay in the years 2003 and 2004, when I was there for a research stay. At this time, I worked together with Jean-François Wyart and Annie Ginibre on the re-examination of protactinium spectra that have been measured about 30 years earlier and that were available in the form of a printed list of peak wavenumbers and a printed paper chart of the intensity profile. The spectra had already been analysed, but there was still a lot of additional information that could be extracted from the spectra with time and effort. The review of the data, the selection of the data and the step-by-step optimization of the data set took a lot of time. When I returned to Berlin in 2004, we had made good progress, but in principle, it is like a bottomless pit. We continued together to optimize the data and tried to the finishing touches to it. At some point, we decided that we had reached a ‘level of maturity’ where the data could be published. We have discussed a lot about how detailed the text should be. This discussion has dragged on over the years and this project has repeatedly been lost in the stream of other everyday tasks. Every now and then there was a small attempt to return to this topic, but it quickly got lost in the daily hustle and bustle. In 2012, we presented the results at a conference. The death of both of them within two years hit me hard. I very much regret that this work was not published earlier. This special volume was the right motivation for me to finally publish this data. I no longer have access neither to the computer programs used at the time, which ran on large computer systems, nor to the original measurement data. I have not been able to find out what happened to the large quantity of paper (printed list of peak wavenumbers anda printed paper chart of spectra). But I have a bunch of input and output files of the calculations that have become a bit jumbled over the years, which contain a lot of information, as well as our unfinished manuscript. The resulting data contain important information for posterity – particularly since the element is radioactive and the experiments to collect laboratory data are unlikely to be repeated any time soon. I think it is worth publishing these data.
High precision FT spectra of Pa: analysis of fine and hyperfine structure
期刊介绍:
The European Physical Journal D (EPJ D) presents new and original research results in:
Atomic Physics;
Molecular Physics and Chemical Physics;
Atomic and Molecular Collisions;
Clusters and Nanostructures;
Plasma Physics;
Laser Cooling and Quantum Gas;
Nonlinear Dynamics;
Optical Physics;
Quantum Optics and Quantum Information;
Ultraintense and Ultrashort Laser Fields.
The range of topics covered in these areas is extensive, from Molecular Interaction and Reactivity to Spectroscopy and Thermodynamics of Clusters, from Atomic Optics to Bose-Einstein Condensation to Femtochemistry.


 分享
分享
 求助内容:
求助内容: 应助结果提醒方式:
 扫码关注我们
