Olufunso Oje, Ofer Amram, Perry Hystad, Assefaw Gebremedhin, Pablo Monsivais
{"title":"Use of individual Google Location History data to identify consumer encounters with food outlets.","authors":"Olufunso Oje, Ofer Amram, Perry Hystad, Assefaw Gebremedhin, Pablo Monsivais","doi":"10.1186/s12942-025-00387-w","DOIUrl":null,"url":null,"abstract":"<p><strong>Background: </strong>Addressing key behavioral risk factors for chronic diseases, such as diet, requires innovative methods to objectively measure dietary patterns and their upstream determinants, notably the food environment. Although GIS techniques have pushed the boundaries by mapping food outlet availability, they often simplify food access dynamics to the vicinity of home addresses, possibly misclassifying neighborhood effects. Leveraging Google Location History Timeline (GLH) data offers a novel approach to assess long-term patterns of food outlet utilization at an individual level, providing insights into the relationship between food environment interactions, diet quality, and health outcomes.</p><p><strong>Methods: </strong>We leveraged GLH data previously collected from a sub-set of participants in the Washington State Twin Registry (WSTR). GLH included more than 287 million location records from 357 participants. We developed methods to identify visits to food outlets using outlet-specific buffer zones applied to the InfoUSA data on food outlet locations. This methodology involved the application of minimum and maximum stay durations, along with revisit intervals. We calculated metrics from the GLH data to detect frequency of visits to different food outlet classifications (e.g. grocery stores, fast food, convenience stores) important to health. Several sensitivity analyses were conducted to examine the robustness of our food outlet metrics and to examine visits occurring within 1 and 2.5 km of residential locations.</p><p><strong>Results: </strong>We identified 156,405 specific food outlet visits for the 357 study participants. 60% were full-service restaurants, 15% limited-service restaurants, and 16% supermarkets. Mean visits per person per month to any food outlet was 12.795. Only 8, 10 and 11% of full-service restaurants, limited-service restaurants, and supermarkets, respectively, occurred within 1 km of residential locations.</p><p><strong>Conclusions: </strong>GLH data presents a novel method to assess individual-level food utilization behaviors.</p>","PeriodicalId":48739,"journal":{"name":"International Journal of Health Geographics","volume":"24 1","pages":"1"},"PeriodicalIF":3.0000,"publicationDate":"2025-02-15","publicationTypes":"Journal Article","fieldsOfStudy":null,"isOpenAccess":false,"openAccessPdf":"https://www.ncbi.nlm.nih.gov/pmc/articles/PMC11830192/pdf/","citationCount":"0","resultStr":null,"platform":"Semanticscholar","paperid":null,"PeriodicalName":"International Journal of Health Geographics","FirstCategoryId":"3","ListUrlMain":"https://doi.org/10.1186/s12942-025-00387-w","RegionNum":2,"RegionCategory":"医学","ArticlePicture":[],"TitleCN":null,"AbstractTextCN":null,"PMCID":null,"EPubDate":"","PubModel":"","JCR":"Q2","JCRName":"PUBLIC, ENVIRONMENTAL & OCCUPATIONAL HEALTH","Score":null,"Total":0}
引用次数: 0
Abstract
Background: Addressing key behavioral risk factors for chronic diseases, such as diet, requires innovative methods to objectively measure dietary patterns and their upstream determinants, notably the food environment. Although GIS techniques have pushed the boundaries by mapping food outlet availability, they often simplify food access dynamics to the vicinity of home addresses, possibly misclassifying neighborhood effects. Leveraging Google Location History Timeline (GLH) data offers a novel approach to assess long-term patterns of food outlet utilization at an individual level, providing insights into the relationship between food environment interactions, diet quality, and health outcomes.
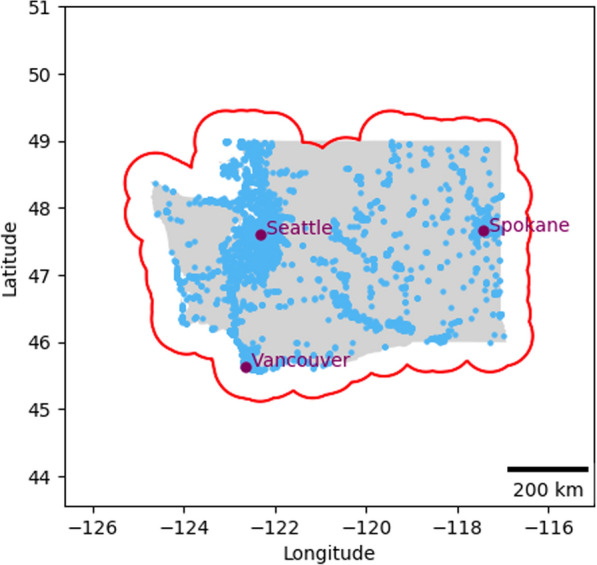
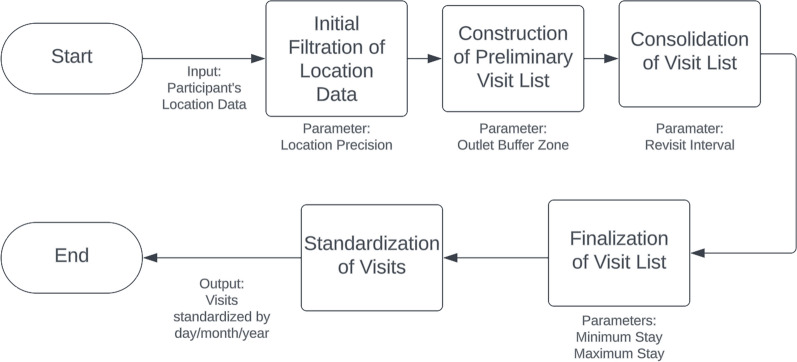
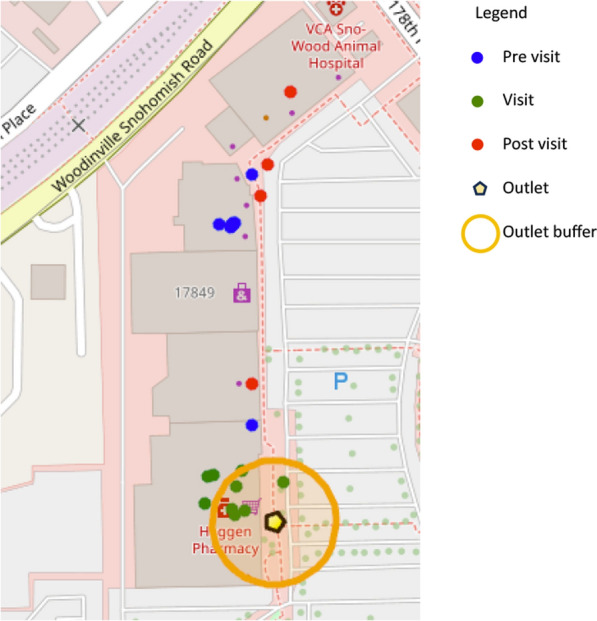
Methods: We leveraged GLH data previously collected from a sub-set of participants in the Washington State Twin Registry (WSTR). GLH included more than 287 million location records from 357 participants. We developed methods to identify visits to food outlets using outlet-specific buffer zones applied to the InfoUSA data on food outlet locations. This methodology involved the application of minimum and maximum stay durations, along with revisit intervals. We calculated metrics from the GLH data to detect frequency of visits to different food outlet classifications (e.g. grocery stores, fast food, convenience stores) important to health. Several sensitivity analyses were conducted to examine the robustness of our food outlet metrics and to examine visits occurring within 1 and 2.5 km of residential locations.
Results: We identified 156,405 specific food outlet visits for the 357 study participants. 60% were full-service restaurants, 15% limited-service restaurants, and 16% supermarkets. Mean visits per person per month to any food outlet was 12.795. Only 8, 10 and 11% of full-service restaurants, limited-service restaurants, and supermarkets, respectively, occurred within 1 km of residential locations.
Conclusions: GLH data presents a novel method to assess individual-level food utilization behaviors.
期刊介绍:
A leader among the field, International Journal of Health Geographics is an interdisciplinary, open access journal publishing internationally significant studies of geospatial information systems and science applications in health and healthcare. With an exceptional author satisfaction rate and a quick time to first decision, the journal caters to readers across an array of healthcare disciplines globally.
International Journal of Health Geographics welcomes novel studies in the health and healthcare context spanning from spatial data infrastructure and Web geospatial interoperability research, to research into real-time Geographic Information Systems (GIS)-enabled surveillance services, remote sensing applications, spatial epidemiology, spatio-temporal statistics, internet GIS and cyberspace mapping, participatory GIS and citizen sensing, geospatial big data, healthy smart cities and regions, and geospatial Internet of Things and blockchain.


 分享
分享
 求助内容:
求助内容: 应助结果提醒方式:
 扫码关注我们
