Simplification of woody plant trait networks among communities along a climatic aridity gradient

IF 5.3 1区 环境科学与生态学 Q1 ECOLOGY Journal of Ecology Pub Date : 2025-02-26 DOI:10.1111/1365-2745.70010
Camila D. Medeiros, Santiago Trueba, Christian Henry, Leila R. Fletcher, James A. Lutz, Rodrigo Méndez Alonzo, Nathan J. B. Kraft, Lawren Sack
{"title":"Simplification of woody plant trait networks among communities along a climatic aridity gradient","authors":"Camila D. Medeiros, Santiago Trueba, Christian Henry, Leila R. Fletcher, James A. Lutz, Rodrigo Méndez Alonzo, Nathan J. B. Kraft, Lawren Sack","doi":"10.1111/1365-2745.70010","DOIUrl":null,"url":null,"abstract":"<h2>1 INTRODUCTION</h2>\n<p>Functional traits are characteristics that influence organism vital rates and thereby fitness (Lavorel &amp; Garnier, <span>2002</span>; Medeiros et al., <span>2019</span>; Poorter et al., <span>2008</span>; Violle et al., <span>2007</span>), and they have long been used to predict species distributions (Engelbrecht et al., <span>2007</span>; Stahl et al., <span>2014</span>; Thuiller et al., <span>2004</span>), community composition (Cavender-Bares et al., <span>2004</span>) and responses to changing climates (Tordoni et al., <span>2022</span>; Trugman et al., <span>2019</span>, <span>2020</span>), with applications in species and ecosystem management (Carlucci et al., <span>2020</span>; Foden et al., <span>2013</span>; Loiseau et al., <span>2020</span>). Much research has focused on using small sets of traits to estimate plant ‘strategies’, ‘axes’ or ‘dimensions’ of function (Díaz et al., <span>2004</span>, <span>2016</span>; Funk et al., <span>2017</span>; Grime, <span>1979</span>; Lavorel &amp; Garnier, <span>2002</span>; Maynard et al., <span>2022</span>; Westoby, <span>1998</span>; Wright et al., <span>2004</span>). Yet, recent work highlights the enormous promise of considering extensive sets of traits and their associations across species (Belluau &amp; Shipley, <span>2018</span>; Fletcher et al., <span>2018</span>; Grubb, <span>2016</span>; He et al., <span>2020</span>; Medeiros et al., <span>2019</span>; Messier et al., <span>2017</span>; Poorter et al., <span>2014</span>; Sack et al., <span>2013</span>; Sack &amp; Buckley, <span>2020</span>). New approaches have emerged to quantify ‘phenotypic integration’ within and among species, in terms of the network connectivity (i.e. the degree the traits that are correlated to each other) and network complexity (i.e. the number of structure–function modules) of the overall web formed by trait–trait relationships (He et al., <span>2020</span>; Li et al., <span>2022</span>; Messier et al., <span>2017</span>).</p>\n<p>The analysis of plant trait networks, henceforth PTNs, enables quantification of the overall architecture of the interconnected web of traits that underlie functional strategies of populations, species or communities, providing a means of integrating trait function at higher scales (Fontana et al., <span>2021</span>; He et al., <span>2020</span>; Li et al., <span>2022</span>; Messier et al., <span>2017</span>; Rao et al., <span>2023</span>). Networks built with nodes and edges are based in graph theory with applications across fields of science (Brooks et al., <span>2020</span>; Markett et al., <span>2018</span>; Salt et al., <span>2008</span>; Tompson et al., <span>2018</span>), including, recently, trait ecology (Boisseaux et al., <span>2025</span>; Flores-Moreno et al., <span>2019</span>; He et al., <span>2020</span>; Kleyer et al., <span>2019</span>; Li et al., <span>2021</span>, <span>2022</span>; Messier et al., <span>2017</span>; Rao et al., <span>2023</span>). In these networks, traits are visualized as ‘nodes’ and statistical correlations between traits as connections (‘edges’; Flores-Moreno et al., <span>2019</span>; He et al., <span>2020</span>). This approach enables the calculation of parameters that describe the connectivity and complexity of the network, including the designation of trait functional modules (Flores-Moreno et al., <span>2019</span>; He et al., <span>2020</span>; Li et al., <span>2021</span>, <span>2022</span>; Rao et al., <span>2023</span>). These parameters are expected to encapsulate information on the functional strategies or syndromes that contribute to the success of species or communities under particular environmental conditions (Sanchez-Martinez et al., <span>2024</span>). Further, besides parameters quantifying whole-network pattern, we can quantify within-network pattern, such as the contribution of each trait to the overall topology of the network, highlighting ‘hub’ and ‘mediator’ traits with, respectively, a disproportionally large number or centrality of connections with other traits, which may be of particular importance in the organization of the integrated phenotype (He et al., <span>2020</span>).</p>\n<p>Importantly, PTNs can be used to test hypotheses for how trait correlations may shift across communities that differ in climate, species, functional richness and/or productivity (He et al., <span>2020</span>; Li et al., <span>2022</span>; Medeiros et al., <span>2019</span>; Sack &amp; Buckley, <span>2020</span>). According to the ‘environmental filtering hypothesis’ and the complementary ‘physiological tolerance hypothesis’, in communities of lower resource or stressful environments that fewer species can tolerate, individual traits would be more likely to specialize to a narrower number of niches; conversely, in communities of environments with higher resource availability and primary productivity more functionally diverse sets of species can be supported (Currie et al., <span>2004</span>; Kraft et al., <span>2015</span>; Le Bagousse-Pinguet et al., <span>2017</span>). Notably, each trait can have several functions (Table 1), and traits may be associated across species due to developmental or structural coordination, contribution to a common functions and/or co-selection by environment (Ahrens et al., <span>2020</span>; Li et al., <span>2022</span>; Sack et al., <span>2003</span>, <span>2012</span>). According to theory, both trait variation and trait associations would tend to arise from trait divergence along a gradient of resource availability (e.g., low vs. high water supply or irradiance). Consequently, in communities accessing lower resources or experiencing greater environmental stress and thus providing fewer niches, traits would tend to optimize separately for stress adaptation, along fewer common spectra (He et al., <span>2020</span>). Thus, given that plants can adapt to stress with alternative designs (Corrêa Dias et al., <span>2019</span>; Marks &amp; Lechowicz, <span>2006</span>)—for example, plants can adapt to drought according to multiple strategies (e.g., ‘avoidance’ or ‘resistance’; Fletcher et al., <span>2022</span>; Laughlin, <span>2023</span>)—adaptation to lower resources or stress would tend to result in a greater independence of traits, and fewer trait correlations (He et al., <span>2020</span>). Thus, we expect that in environments with lower resources, or more stress, community trait networks would show lower connectivity parameters (such as lower edge density and larger average path length and diameter; Table 1). By contrast, for communities accessing higher resources, with less stress, trait network connectivity may be higher, indicating the greater potential for multiple traits within the network to adapt collectively for optimization in specific niches, thus increasing ‘phenotypic integration’ (Vasseur et al., <span>2022</span>). Beyond connectivity, measures of greater network complexity (such as a larger average clustering coefficient and lower modularity; Table 1) indicate a greater diversity of types of trait inter-correlations. Network complexity would also be expected to be lower in lower resource, stressful environments in which traits would adapt to stresses according to alternative designs, whereas network complexity would be greater in high resource environments with greater niche differentiation, as more semi-independent trait modules would be associated with the adaptation of different processes to a greater number of different niche axes within the ecosystem (He et al., <span>2020</span>; Li et al., <span>2021</span>). Thus, we hypothesized that PTNs will be less connected and complex in communities in more arid environments, which also tend to have lower phylogenetic diversity and functional richness and productivity, and, by contrast, PTNs will be more connected and complex in cooler, moister environments, which tend to be associated with higher phylogenetic diversity, functional richness and productivity (Table 1; Currie et al., <span>2004</span>; Li et al., <span>2022</span>).</p>\n<div>\n<header><span>TABLE 1. </span>Network parameters that characterize the architecture of plant trait networks (PTNs) and the centrality and connectivity of the included traits, applied for dominant and common species of sites across a climatic gradient in the California Floristic Province. Network connectivity increases with higher values of edge density, which reflect more interdependence of traits within the network, and lower values of density and average path length, which reflect less independence of traits within the network; PTN complexity increases with higher values of average clustering coefficient, which reflect a network that is less divided into subcomponents, and lower values of modularity, which reflect lower clustering of traits. Trait centrality increases with higher values of betweenness and connectedness, and trait connectivity increases with higher values of closeness and degree of connectedness. For each PTN parameter, we provide a visual guide of what networks with low versus high values for each parameter would look like (modified from He et al., <span><span>2020</span></span>).</header>\n<div tabindex=\"0\">\n<table>\n<thead>\n<tr>\n<th rowspan=\"2\">Parameters</th>\n<th rowspan=\"2\">Definition</th>\n<th colspan=\"5\">Hypotheses for parameter shifts with</th>\n</tr>\n<tr>\n<th style=\"top: 41px;\">Climatic aridity</th>\n<th style=\"top: 41px;\">Functional richness and/or phylogenetic diversity</th>\n<th style=\"top: 41px;\">Net primary productivity</th>\n<th style=\"top: 41px;\">Trait variation</th>\n<th style=\"top: 41px;\">Rationale</th>\n</tr>\n</thead>\n<tbody>\n<tr>\n<td colspan=\"7\">Whole-network parameters</td>\n</tr>\n<tr>\n<td colspan=\"7\" style=\"padding-left:2em;\">Network connectivity</td>\n</tr>\n<tr>\n<td style=\"padding-left:4em;\">\n<p>Edge density</p>\n<p>\n<img alt=\"image\" loading=\"lazy\" src=\"/cms/asset/62854819-5e27-4ecb-b21d-9695c70c5499/jec70010-gra-0001.png\"/>\n</p>\n</td>\n<td>The proportion of connections out of all possible connections</td>\n<td>Decrease</td>\n<td>Increase</td>\n<td>Increase</td>\n<td>-</td>\n<td rowspan=\"3\">In more arid climates, with lower functional richness, multiple traits may independently optimize for stress adaptation, leading to greater independence of traits; this may correspond to a lower productivity (Ahrens et al., <span>2020</span>; He et al., <span>2020</span>; Li et al., <span>2022</span>)</td>\n</tr>\n<tr>\n<td style=\"padding-left:4em;\">\n<p>Average path length</p>\n<p>\n<img alt=\"image\" loading=\"lazy\" src=\"/cms/asset/d2c7a8b3-d339-4fa9-9b4d-0337acc8e637/jec70010-gra-0002.png\"/>\n</p>\n</td>\n<td>The network-averaged shortest distance between traits</td>\n<td>Increase</td>\n<td>Decrease</td>\n<td>Decrease</td>\n<td>-</td>\n</tr>\n<tr>\n<td style=\"padding-left:4em;\">\n<p>Diameter</p>\n<p>\n<img alt=\"image\" loading=\"lazy\" src=\"/cms/asset/bb52be88-8376-41a2-afbc-629fb697c35b/jec70010-gra-0003.png\"/>\n</p>\n</td>\n<td>The maximum shortest distances between traits in the network</td>\n<td>Increase</td>\n<td>Decrease</td>\n<td>Decrease</td>\n<td>-</td>\n</tr>\n<tr>\n<td colspan=\"7\" style=\"padding-left:2em;\">Network complexity</td>\n</tr>\n<tr>\n<td style=\"padding-left:4em;\">\n<p>Average clustering coefficient</p>\n<p>\n<img alt=\"image\" loading=\"lazy\" src=\"/cms/asset/ef1b6a4b-20a4-4a53-86c3-4308032430ce/jec70010-gra-0004.png\"/>\n</p>\n</td>\n<td>The network-averaged clustering coefficient of all traits</td>\n<td>Decrease</td>\n<td>Increase</td>\n<td>Increase</td>\n<td>-</td>\n<td>Traits may be divided into more modules in the moister sites, consistent with the diversification of overall phenotype and function for the occupation of more niches (Currie et al., <span>2004</span>; He et al., <span>2020</span>)</td>\n</tr>\n<tr>\n<td style=\"padding-left:4em;\">\n<p>Modularity</p>\n<p>\n<img alt=\"image\" loading=\"lazy\" src=\"/cms/asset/6ffc7a54-417d-44d4-b43b-a3d23a24efa1/jec70010-gra-0005.png\"/>\n</p>\n</td>\n<td>Measures the degree of separation of trait clusters within the network</td>\n<td>Increase</td>\n<td>Decrease</td>\n<td>Decrease</td>\n<td>-</td>\n<td>Traits within each module may be more independent of traits in separate modules in the more arid sites, consistent with adaptation to drought stress and lower resource availability (Currie et al., <span>2004</span>; He et al., <span>2020</span>)</td>\n</tr>\n<tr>\n<td colspan=\"7\">Within-network parameters</td>\n</tr>\n<tr>\n<td colspan=\"7\" style=\"padding-left:2em;\">Trait centrality</td>\n</tr>\n<tr>\n<td style=\"padding-left:4em;\">\n<p>Betweenness</p>\n<p>\n<img alt=\"image\" loading=\"lazy\" src=\"/cms/asset/4d888320-3216-4214-8301-b6e58c4f2f42/jec70010-gra-0006.png\"/>\n</p>\n</td>\n<td>The number of shortest paths going through a focal trait</td>\n<td>-</td>\n<td>-</td>\n<td>-</td>\n<td>Decrease</td>\n<td rowspan=\"5\">Traits more central and connected within a PTN would be those involved in mediating and compromising among multiple functions (He et al., <span>2020</span>), and thus would have a lower variation across species</td>\n</tr>\n<tr>\n<td style=\"padding-left:4em;\">\n<p>Clustering coefficient</p>\n<p>\n<img alt=\"image\" loading=\"lazy\" src=\"/cms/asset/d973f856-0c09-41ac-8ad5-25f51b84362e/jec70010-gra-0007.png\"/>\n</p>\n</td>\n<td>The proportion of connections between a focal trait and its neighbouring traits out of all possible connections</td>\n<td>-</td>\n<td>-</td>\n<td>-</td>\n<td>Decrease</td>\n</tr>\n<tr>\n<td colspan=\"6\" style=\"padding-left:2em;\">Trait connectedness</td>\n</tr>\n<tr>\n<td style=\"padding-left:4em;\">\n<p>Closeness</p>\n<p>\n<img alt=\"image\" loading=\"lazy\" src=\"/cms/asset/4dfbd15f-e723-45fe-9e0a-f89960557b85/jec70010-gra-0008.png\"/>\n</p>\n</td>\n<td>The mean shortest path between a focal trait and all other traits in the network</td>\n<td>-</td>\n<td>-</td>\n<td>-</td>\n<td>Decrease</td>\n</tr>\n<tr>\n<td style=\"padding-left:4em;\">\n<p>Degree of connectedness</p>\n<p>\n<img alt=\"image\" loading=\"lazy\" src=\"/cms/asset/5da99428-47cf-4ef1-969b-6a5afbec7742/jec70010-gra-0009.png\"/>\n</p>\n</td>\n<td>The number of connections of a focal trait</td>\n<td>-</td>\n<td>-</td>\n<td>-</td>\n<td>Decrease</td>\n</tr>\n</tbody>\n</table>\n</div>\n<div></div>\n</div>\n<p>Previous studies have provided partial support for these hypotheses across continental or global latitudinal gradients. One previous study tested variation in PTNs based on 35 leaf structure and composition traits across communities, considering forests across latitudes in China from cold boreal sites to warm, moist tropical sites. That study found that PTN connectivity and complexity increased from colder climate forests to wetter and warmer tropical forests with greater species richness (Li et al., <span>2021</span>, <span>2022</span>). Another previous study utilized a compiled global database for 10 traits to consider shifts in parameters across biomes from boreal to tropical regions and found that for woody plants, trait network connectivity and network complexity were lower in polar than in other global regions (Flores-Moreno et al., <span>2019</span>).</p>\n<p>Notably, both those previous studies investigated the relationship of PTN connectivity and complexity with the greater warmth and moisture at lower latitudes, and thus neither focused on climatic aridity, that is, whether soil or atmospheric drought (as opposed to cold climates) could be a driver of PTN shifts. In this study, we focused on communities across an aridity gradient in the California bioregion, from forests in cool, moist climates to semi-desert in hot, dry climates. Here, we provide a first test of trait network shifts for communities across a marked aridity gradient, from cool, moist to hot, dry sites, providing insights into drought adaptation of species and communities, a topic of increasing urgency given global change increases the frequency and intensity of high-temperature drought conditions in many regions. We also introduce tests of the relationship of network complexity to primary productivity (gross and net primary productivity [GPP and NPP]), and functional richness, which tend to be associated with environments with higher resource availability and lower stress (Currie et al., <span>2004</span>; Kraft et al., <span>2015</span>; Le Bagousse-Pinguet et al., <span>2017</span>; Li et al., <span>2022</span>).</p>\n<p>In addition to our novel focus on the shifts in plant community trait networks across an aridity gradient, we also tested a new hypothesis for the patterning of variation among traits within a network, that is, that traits that are more connected and ‘hub-like’ in PTNs tend to be those with low variation across species means (i.e., with a low coefficient of variation). We thus tested how the connectedness and centrality of the traits within the networks relate to trait variability (Table 1). Certain traits, such as, by hypothesis, the leaf mass per area, may be involved in multiple axes of function (including, e.g., resource retentiveness and drought tolerance, John et al., <span>2017</span>; Wright et al., <span>2004</span>). A previous study of forests across a continental latitudinal gradient found that trait connectivity within networks was conserved, with certain traits playing a stronger integrating role in the phenotype regardless of the species set (He et al., <span>2020</span>), implying potential involvement in multiple functions (cf. Marks, <span>2007</span>). We hypothesized that traits with greatest connectivity within the PTN, being involved in mediating multiple functions, would tend to show lower variation across species relative to other traits less connected in the PTN (Table 1).</p>\n<p>To test these hypotheses, we built a novel database of high resolution, standard mechanistic functional traits, including hydraulic, anatomical, composition, economic and structural, for diverse communities across a bioregion in the California Floristic Province (CAFP), an endemism-rich biodiversity hotspot (Baldwin, <span>2014</span>). We quantified 34 functional traits (listed with functions, symbols and units in Table 2) in 118 unique species (Table S1) sampled from six key plant communities that represent approximately 70% of the CAFP land area (Thorne et al., <span>2017</span>), including desert, coastal sage scrub, chaparral, montane wet forest, mixed riparian woodland and mixed conifer-broad-leaf-forest sites (Table 3). A previous study focused on 10 key traits that were strongly associated with aridity in species' native ranges along this gradient (Medeiros et al., <span>2023</span>). In this study, we consider an expanded, three times larger trait dataset representing multiple levels of plant function, including hydraulics, nutrient composition, plant size, and leaf and wood economics and structure (Table 2). We built PTNs for each plant community and tested the hypothesized relationships of trait connectivity (through the PTN parameters edge density, average path length and diameter) and network complexity (through the PTN parameters average clustering coefficient and modularity) with site aridity, functional richness and primary productivity.</p>\n<div>\n<header><span>TABLE 2. </span>List of traits, their functions and completeness (the percent of species with observations). We present symbols and units for the 34 traits quantified for 118 species from six plant communities across a climatic gradient in the California Floristic Province. The traits relate to six measurement categories: Epidermal morphology, leaf economics and structure, wood economics and structure, leaf composition, hydraulics and plant size. Functions: 1. Gas exchange (photosynthesis and transpiration); 2. Light relations; 3. Herbivory defence; 4. Metabolism; 5. Organ structure; 6. Water transport; 7. Seed dispersal.</header>\n<div tabindex=\"0\">\n<table>\n<thead>\n<tr>\n<th>Trait</th>\n<th>Symbol</th>\n<th>Unit</th>\n<th>Function(s)</th>\n<th>Trait completeness (%)</th>\n</tr>\n</thead>\n<tbody>\n<tr>\n<td colspan=\"5\">Epidermal morphology</td>\n</tr>\n<tr>\n<td style=\"padding-left:2em;\">Stomatal density</td>\n<td>\n<i>d</i>\n</td>\n<td>n μm<sup>−2</sup></td>\n<td>1</td>\n<td>82</td>\n</tr>\n<tr>\n<td style=\"padding-left:2em;\">Stomatal area</td>\n<td>\n<i>s</i>\n</td>\n<td>μm<sup>2</sup></td>\n<td>1</td>\n<td>88</td>\n</tr>\n<tr>\n<td style=\"padding-left:2em;\">Epidermal pavement cell area</td>\n<td>\n<i>e</i>\n</td>\n<td>μm<sup>2</sup></td>\n<td>4, 5</td>\n<td>94</td>\n</tr>\n<tr>\n<td style=\"padding-left:2em;\">Trichome density</td>\n<td>\n<i>t</i>\n</td>\n<td>n μm<sup>−2</sup></td>\n<td>1, 2, 3</td>\n<td>90</td>\n</tr>\n<tr>\n<td colspan=\"5\">Leaf economics and structure</td>\n</tr>\n<tr>\n<td style=\"padding-left:2em;\">Leaf area</td>\n<td>\n<i>LA</i>\n</td>\n<td>cm<sup>2</sup></td>\n<td>1, 2, 5, 6</td>\n<td>98</td>\n</tr>\n<tr>\n<td style=\"padding-left:2em;\">Leaf mass per area</td>\n<td>\n<i>LMA</i>\n</td>\n<td>g m<sup>−2</sup></td>\n<td>1, 2, 3, 4, 5</td>\n<td>98</td>\n</tr>\n<tr>\n<td style=\"padding-left:2em;\">Leaf thickness</td>\n<td>\n<i>LT</i>\n</td>\n<td>mm</td>\n<td>1, 2, 3, 4, 5</td>\n<td>98</td>\n</tr>\n<tr>\n<td style=\"padding-left:2em;\">Leaf dry matter content</td>\n<td>\n<i>LDMC</i>\n</td>\n<td>g g<sup>−1</sup></td>\n<td>1, 3, 4, 5</td>\n<td>98</td>\n</tr>\n<tr>\n<td style=\"padding-left:2em;\">Percentage loss area (dry)</td>\n<td>\n<i>PLA</i>\n<sub>dry</sub>\n</td>\n<td>%</td>\n<td>5, 6</td>\n<td>91</td>\n</tr>\n<tr>\n<td colspan=\"5\">Wood economics and structure</td>\n</tr>\n<tr>\n<td style=\"padding-left:2em;\">Wood density</td>\n<td>\n<i>WD</i>\n</td>\n<td>g cm<sup>−3</sup></td>\n<td>3, 5, 6</td>\n<td>100</td>\n</tr>\n<tr>\n<td colspan=\"5\">Leaf composition</td>\n</tr>\n<tr>\n<td style=\"padding-left:2em;\">Carbon per leaf mass</td>\n<td>C</td>\n<td>mg g<sup>−1</sup></td>\n<td>1, 3, 4, 5</td>\n<td>94</td>\n</tr>\n<tr>\n<td style=\"padding-left:2em;\">Nitrogen per leaf mass</td>\n<td>N</td>\n<td>mg g<sup>−1</sup></td>\n<td>1, 2, 3, 4</td>\n<td>94</td>\n</tr>\n<tr>\n<td style=\"padding-left:2em;\">Phosphorus per leaf mass</td>\n<td>P</td>\n<td>mg g<sup>−1</sup></td>\n<td>1, 2, 4</td>\n<td>88</td>\n</tr>\n<tr>\n<td style=\"padding-left:2em;\">Potassium per leaf mass</td>\n<td>K</td>\n<td>mg g<sup>−1</sup></td>\n<td>1, 4, 6</td>\n<td>88</td>\n</tr>\n<tr>\n<td style=\"padding-left:2em;\">Calcium per leaf mass</td>\n<td>Ca</td>\n<td>mg g<sup>−1</sup></td>\n<td>1, 4, 5, 6</td>\n<td>88</td>\n</tr>\n<tr>\n<td style=\"padding-left:2em;\">Magnesium per leaf mass</td>\n<td>Mg</td>\n<td>mg g<sup>−1</sup></td>\n<td>1, 2, 4</td>\n<td>88</td>\n</tr>\n<tr>\n<td style=\"padding-left:2em;\">Iron per leaf mass</td>\n<td>Fe</td>\n<td>ppm</td>\n<td>1, 2, 4</td>\n<td>88</td>\n</tr>\n<tr>\n<td style=\"padding-left:2em;\">Boron per leaf mass</td>\n<td>B</td>\n<td>ppm</td>\n<td>4, 5</td>\n<td>88</td>\n</tr>\n<tr>\n<td style=\"padding-left:2em;\">Manganese per leaf mass</td>\n<td>Mn</td>\n<td>mg g<sup>−1</sup></td>\n<td>1, 2, 4</td>\n<td>88</td>\n</tr>\n<tr>\n<td style=\"padding-left:2em;\">Sodium per leaf mass</td>\n<td>Na</td>\n<td>mg g<sup>−1</sup></td>\n<td>4, 6</td>\n<td>88</td>\n</tr>\n<tr>\n<td style=\"padding-left:2em;\">Zinc per leaf mass</td>\n<td>Zn</td>\n<td>mg g<sup>−1</sup></td>\n<td>1, 2, 4</td>\n<td>88</td>\n</tr>\n<tr>\n<td style=\"padding-left:2em;\">Copper per leaf mass</td>\n<td>Cu</td>\n<td>mg g<sup>−1</sup></td>\n<td>1, 2, 4, 5</td>\n<td>88</td>\n</tr>\n<tr>\n<td style=\"padding-left:2em;\">Molybdenum per leaf mass</td>\n<td>Mo</td>\n<td>mg g<sup>−1</sup></td>\n<td>1, 2, 4</td>\n<td>88</td>\n</tr>\n<tr>\n<td style=\"padding-left:2em;\">Cobalt per leaf mass</td>\n<td>Co</td>\n<td>mg g<sup>−1</sup></td>\n<td>4</td>\n<td>88</td>\n</tr>\n<tr>\n<td style=\"padding-left:2em;\">Aluminium per leaf mass</td>\n<td>Al</td>\n<td>mg g<sup>−1</sup></td>\n<td>4</td>\n<td>88</td>\n</tr>\n<tr>\n<td style=\"padding-left:2em;\">Arsenic per leaf mass</td>\n<td>As</td>\n<td>mg g<sup>−1</sup></td>\n<td>4</td>\n<td>88</td>\n</tr>\n<tr>\n<td style=\"padding-left:2em;\">Cadmium per leaf mass</td>\n<td>Cd</td>\n<td>mg g<sup>−1</sup></td>\n<td>4</td>\n<td>88</td>\n</tr>\n<tr>\n<td style=\"padding-left:2em;\">Rubidium per leaf mass</td>\n<td>Rb</td>\n<td>mg g<sup>−1</sup></td>\n<td>4</td>\n<td>88</td>\n</tr>\n<tr>\n<td style=\"padding-left:2em;\">Strontium per leaf mass</td>\n<td>Sr</td>\n<td>mg g<sup>−1</sup></td>\n<td>4</td>\n<td>88</td>\n</tr>\n<tr>\n<td style=\"padding-left:2em;\">Chlorophyll per mass</td>\n<td>\n<i>Chl</i>\n</td>\n<td>SPAD g<sup>−1</sup> m<sup>2</sup></td>\n<td>1, 2, 4</td>\n<td>86</td>\n</tr>\n<tr>\n<td style=\"padding-left:2em;\">Carbon isotope discrimination</td>\n<td>Δ<sup>13</sup>C</td>\n<td>‰</td>\n<td>1</td>\n<td>94</td>\n</tr>\n<tr>\n<td colspan=\"5\">Hydraulics</td>\n</tr>\n<tr>\n<td style=\"padding-left:2em;\">Water potential at turgor loss point</td>\n<td>\n<i>π</i>\n<sub>tlp</sub>\n</td>\n<td>MPa</td>\n<td>1, 6</td>\n<td>98</td>\n</tr>\n<tr>\n<td colspan=\"5\">Plant size</td>\n</tr>\n<tr>\n<td style=\"padding-left:2em;\">Maximum height</td>\n<td>\n<i>H</i>\n<sub>max</sub>\n</td>\n<td>m</td>\n<td>1, 2, 5, 6</td>\n<td>100</td>\n</tr>\n<tr>\n<td style=\"padding-left:2em;\">Seed mass</td>\n<td>\n<i>SM</i>\n</td>\n<td>mg</td>\n<td>7</td>\n<td>78</td>\n</tr>\n</tbody>\n</table>\n</div>\n<div></div>\n</div>\n<div>\n<header><span>TABLE 3. </span>Plant communities sampled across California (United States) and Baja California (Mexico), including site abbreviations and names, dominant vegetation type, latitude and longitude of the site centroid, number of species and families sampled, the aridity index, AI (lower AI values signify higher climatic aridity), mean annual precipitation, MAP and temperature, MAT. Site climate was modelled from a 100-ha buffer zone around each site's centroid. From left to right, sites are ordered from low to high climatic aridity.</header>\n<div tabindex=\"0\">\n<table>\n<thead>\n<tr>\n<td></td>\n<th>Mixed conifer-broadleaf forest</th>\n<th>Mixed riparian woodland</th>\n<th>Montane wet forest</th>\n<th>Chaparral</th>\n<th>Coastal sage scrub</th>\n<th>Desert</th>\n</tr>\n</thead>\n<tbody>\n<tr>\n<td>Site</td>\n<td>Angelo Coast Range Reserve</td>\n<td>Onion Creek</td>\n<td>Yosemite Forest Dynamics Plot</td>\n<td>Stunt Ranch Santa Monica Mountains Reserve</td>\n<td>Centro de Investigación Científica y de Educación Superior de Ensenada</td>\n<td>Sweeney Granite Mountains Desert Research Center</td>\n</tr>\n<tr>\n<td>Vegetation type</td>\n<td>Mixed conifer-broadleaf-forest</td>\n<td>Mixed riparian woodland</td>\n<td>Montane wet forest</td>\n<td>Chaparral</td>\n<td>Coastal sage scrub</td>\n<td>Desert</td>\n</tr>\n<tr>\n<td>Latitude</td>\n<td>39.7185431</td>\n<td>39.274627</td>\n<td>37.8529772</td>\n<td>34.0955321</td>\n<td>31.869475</td>\n<td>34.7813355</td>\n</tr>\n<tr>\n<td>Longitude</td>\n<td>−123.65505</td>\n<td>−120.36545</td>\n<td>−119.83129</td>\n<td>−118.66148</td>\n<td>−116.66689</td>\n<td>−115.65598</td>\n</tr>\n<tr>\n<td>N species sampled</td>\n<td>21</td>\n<td>19</td>\n<td>20</td>\n<td>26</td>\n<td>22</td>\n<td>28</td>\n</tr>\n<tr>\n<td>Dominant functional types</td>\n<td>Mixed deciduous and evergreen shrubs and trees</td>\n<td>Mixed deciduous and evergreen shrubs and trees</td>\n<td>Deciduous shrubs and evergreen needleleaf trees</td>\n<td>Evergreen shrubs</td>\n<td>Evergreen shrubs</td>\n<td>Deciduous/semi-deciduous shrubs</td>\n</tr>\n<tr>\n<td>AI</td>\n<td>1.18</td>\n<td>0.755</td>\n<td>0.539</td>\n<td>0.215</td>\n<td>0.121</td>\n<td>0.0959</td>\n</tr>\n<tr>\n<td>MAP (mm)</td>\n<td>1613</td>\n<td>1122</td>\n<td>977</td>\n<td>412</td>\n<td>256</td>\n<td>263</td>\n</tr>\n<tr>\n<td>MAT (°C)</td>\n<td>11.4</td>\n<td>6.46</td>\n<td>10.7</td>\n<td>16.4</td>\n<td>16.4</td>\n<td>16.6</td>\n</tr>\n</tbody>\n</table>\n</div>\n<div></div>\n</div>","PeriodicalId":191,"journal":{"name":"Journal of Ecology","volume":"32 1","pages":""},"PeriodicalIF":5.3000,"publicationDate":"2025-02-26","publicationTypes":"Journal Article","fieldsOfStudy":null,"isOpenAccess":false,"openAccessPdf":"","citationCount":"0","resultStr":null,"platform":"Semanticscholar","paperid":null,"PeriodicalName":"Journal of Ecology","FirstCategoryId":"93","ListUrlMain":"https://doi.org/10.1111/1365-2745.70010","RegionNum":1,"RegionCategory":"环境科学与生态学","ArticlePicture":[],"TitleCN":null,"AbstractTextCN":null,"PMCID":null,"EPubDate":"","PubModel":"","JCR":"Q1","JCRName":"ECOLOGY","Score":null,"Total":0}
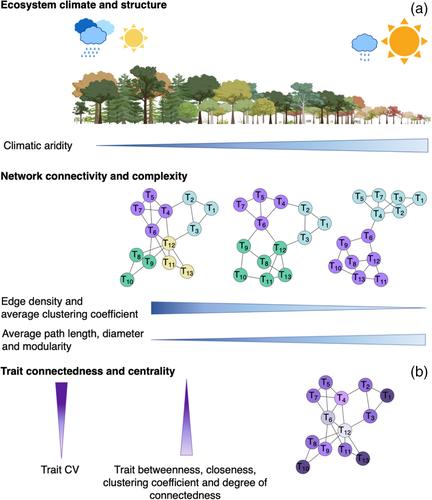
引用次数: 0

Abstract

1 INTRODUCTION

Functional traits are characteristics that influence organism vital rates and thereby fitness (Lavorel & Garnier, 2002; Medeiros et al., 2019; Poorter et al., 2008; Violle et al., 2007), and they have long been used to predict species distributions (Engelbrecht et al., 2007; Stahl et al., 2014; Thuiller et al., 2004), community composition (Cavender-Bares et al., 2004) and responses to changing climates (Tordoni et al., 2022; Trugman et al., 2019, 2020), with applications in species and ecosystem management (Carlucci et al., 2020; Foden et al., 2013; Loiseau et al., 2020). Much research has focused on using small sets of traits to estimate plant ‘strategies’, ‘axes’ or ‘dimensions’ of function (Díaz et al., 2004, 2016; Funk et al., 2017; Grime, 1979; Lavorel & Garnier, 2002; Maynard et al., 2022; Westoby, 1998; Wright et al., 2004). Yet, recent work highlights the enormous promise of considering extensive sets of traits and their associations across species (Belluau & Shipley, 2018; Fletcher et al., 2018; Grubb, 2016; He et al., 2020; Medeiros et al., 2019; Messier et al., 2017; Poorter et al., 2014; Sack et al., 2013; Sack & Buckley, 2020). New approaches have emerged to quantify ‘phenotypic integration’ within and among species, in terms of the network connectivity (i.e. the degree the traits that are correlated to each other) and network complexity (i.e. the number of structure–function modules) of the overall web formed by trait–trait relationships (He et al., 2020; Li et al., 2022; Messier et al., 2017).

The analysis of plant trait networks, henceforth PTNs, enables quantification of the overall architecture of the interconnected web of traits that underlie functional strategies of populations, species or communities, providing a means of integrating trait function at higher scales (Fontana et al., 2021; He et al., 2020; Li et al., 2022; Messier et al., 2017; Rao et al., 2023). Networks built with nodes and edges are based in graph theory with applications across fields of science (Brooks et al., 2020; Markett et al., 2018; Salt et al., 2008; Tompson et al., 2018), including, recently, trait ecology (Boisseaux et al., 2025; Flores-Moreno et al., 2019; He et al., 2020; Kleyer et al., 2019; Li et al., 2021, 2022; Messier et al., 2017; Rao et al., 2023). In these networks, traits are visualized as ‘nodes’ and statistical correlations between traits as connections (‘edges’; Flores-Moreno et al., 2019; He et al., 2020). This approach enables the calculation of parameters that describe the connectivity and complexity of the network, including the designation of trait functional modules (Flores-Moreno et al., 2019; He et al., 2020; Li et al., 2021, 2022; Rao et al., 2023). These parameters are expected to encapsulate information on the functional strategies or syndromes that contribute to the success of species or communities under particular environmental conditions (Sanchez-Martinez et al., 2024). Further, besides parameters quantifying whole-network pattern, we can quantify within-network pattern, such as the contribution of each trait to the overall topology of the network, highlighting ‘hub’ and ‘mediator’ traits with, respectively, a disproportionally large number or centrality of connections with other traits, which may be of particular importance in the organization of the integrated phenotype (He et al., 2020).

Importantly, PTNs can be used to test hypotheses for how trait correlations may shift across communities that differ in climate, species, functional richness and/or productivity (He et al., 2020; Li et al., 2022; Medeiros et al., 2019; Sack & Buckley, 2020). According to the ‘environmental filtering hypothesis’ and the complementary ‘physiological tolerance hypothesis’, in communities of lower resource or stressful environments that fewer species can tolerate, individual traits would be more likely to specialize to a narrower number of niches; conversely, in communities of environments with higher resource availability and primary productivity more functionally diverse sets of species can be supported (Currie et al., 2004; Kraft et al., 2015; Le Bagousse-Pinguet et al., 2017). Notably, each trait can have several functions (Table 1), and traits may be associated across species due to developmental or structural coordination, contribution to a common functions and/or co-selection by environment (Ahrens et al., 2020; Li et al., 2022; Sack et al., 2003, 2012). According to theory, both trait variation and trait associations would tend to arise from trait divergence along a gradient of resource availability (e.g., low vs. high water supply or irradiance). Consequently, in communities accessing lower resources or experiencing greater environmental stress and thus providing fewer niches, traits would tend to optimize separately for stress adaptation, along fewer common spectra (He et al., 2020). Thus, given that plants can adapt to stress with alternative designs (Corrêa Dias et al., 2019; Marks & Lechowicz, 2006)—for example, plants can adapt to drought according to multiple strategies (e.g., ‘avoidance’ or ‘resistance’; Fletcher et al., 2022; Laughlin, 2023)—adaptation to lower resources or stress would tend to result in a greater independence of traits, and fewer trait correlations (He et al., 2020). Thus, we expect that in environments with lower resources, or more stress, community trait networks would show lower connectivity parameters (such as lower edge density and larger average path length and diameter; Table 1). By contrast, for communities accessing higher resources, with less stress, trait network connectivity may be higher, indicating the greater potential for multiple traits within the network to adapt collectively for optimization in specific niches, thus increasing ‘phenotypic integration’ (Vasseur et al., 2022). Beyond connectivity, measures of greater network complexity (such as a larger average clustering coefficient and lower modularity; Table 1) indicate a greater diversity of types of trait inter-correlations. Network complexity would also be expected to be lower in lower resource, stressful environments in which traits would adapt to stresses according to alternative designs, whereas network complexity would be greater in high resource environments with greater niche differentiation, as more semi-independent trait modules would be associated with the adaptation of different processes to a greater number of different niche axes within the ecosystem (He et al., 2020; Li et al., 2021). Thus, we hypothesized that PTNs will be less connected and complex in communities in more arid environments, which also tend to have lower phylogenetic diversity and functional richness and productivity, and, by contrast, PTNs will be more connected and complex in cooler, moister environments, which tend to be associated with higher phylogenetic diversity, functional richness and productivity (Table 1; Currie et al., 2004; Li et al., 2022).

TABLE 1. Network parameters that characterize the architecture of plant trait networks (PTNs) and the centrality and connectivity of the included traits, applied for dominant and common species of sites across a climatic gradient in the California Floristic Province. Network connectivity increases with higher values of edge density, which reflect more interdependence of traits within the network, and lower values of density and average path length, which reflect less independence of traits within the network; PTN complexity increases with higher values of average clustering coefficient, which reflect a network that is less divided into subcomponents, and lower values of modularity, which reflect lower clustering of traits. Trait centrality increases with higher values of betweenness and connectedness, and trait connectivity increases with higher values of closeness and degree of connectedness. For each PTN parameter, we provide a visual guide of what networks with low versus high values for each parameter would look like (modified from He et al., 2020).
Parameters Definition Hypotheses for parameter shifts with
Climatic aridity Functional richness and/or phylogenetic diversity Net primary productivity Trait variation Rationale
Whole-network parameters
Network connectivity

Edge density

Abstract Image

The proportion of connections out of all possible connections Decrease Increase Increase - In more arid climates, with lower functional richness, multiple traits may independently optimize for stress adaptation, leading to greater independence of traits; this may correspond to a lower productivity (Ahrens et al., 2020; He et al., 2020; Li et al., 2022)

Average path length

Abstract Image

The network-averaged shortest distance between traits Increase Decrease Decrease -

Diameter

Abstract Image

The maximum shortest distances between traits in the network Increase Decrease Decrease -
Network complexity

Average clustering coefficient

Abstract Image

The network-averaged clustering coefficient of all traits Decrease Increase Increase - Traits may be divided into more modules in the moister sites, consistent with the diversification of overall phenotype and function for the occupation of more niches (Currie et al., 2004; He et al., 2020)

Modularity

Abstract Image

Measures the degree of separation of trait clusters within the network Increase Decrease Decrease - Traits within each module may be more independent of traits in separate modules in the more arid sites, consistent with adaptation to drought stress and lower resource availability (Currie et al., 2004; He et al., 2020)
Within-network parameters
Trait centrality

Betweenness

Abstract Image

The number of shortest paths going through a focal trait - - - Decrease Traits more central and connected within a PTN would be those involved in mediating and compromising among multiple functions (He et al., 2020), and thus would have a lower variation across species

Clustering coefficient

Abstract Image

The proportion of connections between a focal trait and its neighbouring traits out of all possible connections - - - Decrease
Trait connectedness

Closeness

Abstract Image

The mean shortest path between a focal trait and all other traits in the network - - - Decrease

Degree of connectedness

Abstract Image

The number of connections of a focal trait - - - Decrease

Previous studies have provided partial support for these hypotheses across continental or global latitudinal gradients. One previous study tested variation in PTNs based on 35 leaf structure and composition traits across communities, considering forests across latitudes in China from cold boreal sites to warm, moist tropical sites. That study found that PTN connectivity and complexity increased from colder climate forests to wetter and warmer tropical forests with greater species richness (Li et al., 2021, 2022). Another previous study utilized a compiled global database for 10 traits to consider shifts in parameters across biomes from boreal to tropical regions and found that for woody plants, trait network connectivity and network complexity were lower in polar than in other global regions (Flores-Moreno et al., 2019).

Notably, both those previous studies investigated the relationship of PTN connectivity and complexity with the greater warmth and moisture at lower latitudes, and thus neither focused on climatic aridity, that is, whether soil or atmospheric drought (as opposed to cold climates) could be a driver of PTN shifts. In this study, we focused on communities across an aridity gradient in the California bioregion, from forests in cool, moist climates to semi-desert in hot, dry climates. Here, we provide a first test of trait network shifts for communities across a marked aridity gradient, from cool, moist to hot, dry sites, providing insights into drought adaptation of species and communities, a topic of increasing urgency given global change increases the frequency and intensity of high-temperature drought conditions in many regions. We also introduce tests of the relationship of network complexity to primary productivity (gross and net primary productivity [GPP and NPP]), and functional richness, which tend to be associated with environments with higher resource availability and lower stress (Currie et al., 2004; Kraft et al., 2015; Le Bagousse-Pinguet et al., 2017; Li et al., 2022).

In addition to our novel focus on the shifts in plant community trait networks across an aridity gradient, we also tested a new hypothesis for the patterning of variation among traits within a network, that is, that traits that are more connected and ‘hub-like’ in PTNs tend to be those with low variation across species means (i.e., with a low coefficient of variation). We thus tested how the connectedness and centrality of the traits within the networks relate to trait variability (Table 1). Certain traits, such as, by hypothesis, the leaf mass per area, may be involved in multiple axes of function (including, e.g., resource retentiveness and drought tolerance, John et al., 2017; Wright et al., 2004). A previous study of forests across a continental latitudinal gradient found that trait connectivity within networks was conserved, with certain traits playing a stronger integrating role in the phenotype regardless of the species set (He et al., 2020), implying potential involvement in multiple functions (cf. Marks, 2007). We hypothesized that traits with greatest connectivity within the PTN, being involved in mediating multiple functions, would tend to show lower variation across species relative to other traits less connected in the PTN (Table 1).

To test these hypotheses, we built a novel database of high resolution, standard mechanistic functional traits, including hydraulic, anatomical, composition, economic and structural, for diverse communities across a bioregion in the California Floristic Province (CAFP), an endemism-rich biodiversity hotspot (Baldwin, 2014). We quantified 34 functional traits (listed with functions, symbols and units in Table 2) in 118 unique species (Table S1) sampled from six key plant communities that represent approximately 70% of the CAFP land area (Thorne et al., 2017), including desert, coastal sage scrub, chaparral, montane wet forest, mixed riparian woodland and mixed conifer-broad-leaf-forest sites (Table 3). A previous study focused on 10 key traits that were strongly associated with aridity in species' native ranges along this gradient (Medeiros et al., 2023). In this study, we consider an expanded, three times larger trait dataset representing multiple levels of plant function, including hydraulics, nutrient composition, plant size, and leaf and wood economics and structure (Table 2). We built PTNs for each plant community and tested the hypothesized relationships of trait connectivity (through the PTN parameters edge density, average path length and diameter) and network complexity (through the PTN parameters average clustering coefficient and modularity) with site aridity, functional richness and primary productivity.

TABLE 2. List of traits, their functions and completeness (the percent of species with observations). We present symbols and units for the 34 traits quantified for 118 species from six plant communities across a climatic gradient in the California Floristic Province. The traits relate to six measurement categories: Epidermal morphology, leaf economics and structure, wood economics and structure, leaf composition, hydraulics and plant size. Functions: 1. Gas exchange (photosynthesis and transpiration); 2. Light relations; 3. Herbivory defence; 4. Metabolism; 5. Organ structure; 6. Water transport; 7. Seed dispersal.
Trait Symbol Unit Function(s) Trait completeness (%)
Epidermal morphology
Stomatal density d n μm−2 1 82
Stomatal area s μm2 1 88
Epidermal pavement cell area e μm2 4, 5 94
Trichome density t n μm−2 1, 2, 3 90
Leaf economics and structure
Leaf area LA cm2 1, 2, 5, 6 98
Leaf mass per area LMA g m−2 1, 2, 3, 4, 5 98
Leaf thickness LT mm 1, 2, 3, 4, 5 98
Leaf dry matter content LDMC g g−1 1, 3, 4, 5 98
Percentage loss area (dry) PLA dry % 5, 6 91
Wood economics and structure
Wood density WD g cm−3 3, 5, 6 100
Leaf composition
Carbon per leaf mass C mg g−1 1, 3, 4, 5 94
Nitrogen per leaf mass N mg g−1 1, 2, 3, 4 94
Phosphorus per leaf mass P mg g−1 1, 2, 4 88
Potassium per leaf mass K mg g−1 1, 4, 6 88
Calcium per leaf mass Ca mg g−1 1, 4, 5, 6 88
Magnesium per leaf mass Mg mg g−1 1, 2, 4 88
Iron per leaf mass Fe ppm 1, 2, 4 88
Boron per leaf mass B ppm 4, 5 88
Manganese per leaf mass Mn mg g−1 1, 2, 4 88
Sodium per leaf mass Na mg g−1 4, 6 88
Zinc per leaf mass Zn mg g−1 1, 2, 4 88
Copper per leaf mass Cu mg g−1 1, 2, 4, 5 88
Molybdenum per leaf mass Mo mg g−1 1, 2, 4 88
Cobalt per leaf mass Co mg g−1 4 88
Aluminium per leaf mass Al mg g−1 4 88
Arsenic per leaf mass As mg g−1 4 88
Cadmium per leaf mass Cd mg g−1 4 88
Rubidium per leaf mass Rb mg g−1 4 88
Strontium per leaf mass Sr mg g−1 4 88
Chlorophyll per mass Chl SPAD g−1 m2 1, 2, 4 86
Carbon isotope discrimination Δ13C 1 94
Hydraulics
Water potential at turgor loss point π tlp MPa 1, 6 98
Plant size
Maximum height H max m 1, 2, 5, 6 100
Seed mass SM mg 7 78
TABLE 3. Plant communities sampled across California (United States) and Baja California (Mexico), including site abbreviations and names, dominant vegetation type, latitude and longitude of the site centroid, number of species and families sampled, the aridity index, AI (lower AI values signify higher climatic aridity), mean annual precipitation, MAP and temperature, MAT. Site climate was modelled from a 100-ha buffer zone around each site's centroid. From left to right, sites are ordered from low to high climatic aridity.
Mixed conifer-broadleaf forest Mixed riparian woodland Montane wet forest Chaparral Coastal sage scrub Desert
Site Angelo Coast Range Reserve Onion Creek Yosemite Forest Dynamics Plot Stunt Ranch Santa Monica Mountains Reserve Centro de Investigación Científica y de Educación Superior de Ensenada Sweeney Granite Mountains Desert Research Center
Vegetation type Mixed conifer-broadleaf-forest Mixed riparian woodland Montane wet forest Chaparral Coastal sage scrub Desert
Latitude 39.7185431 39.274627 37.8529772 34.0955321 31.869475 34.7813355
Longitude −123.65505 −120.36545 −119.83129 −118.66148 −116.66689 −115.65598
N species sampled 21 19 20 26 22 28
Dominant functional types Mixed deciduous and evergreen shrubs and trees Mixed deciduous and evergreen shrubs and trees Deciduous shrubs and evergreen needleleaf trees Evergreen shrubs Evergreen shrubs Deciduous/semi-deciduous shrubs
AI 1.18 0.755 0.539 0.215 0.121 0.0959
MAP (mm) 1613 1122 977 412 256 263
MAT (°C) 11.4 6.46 10.7 16.4 16.4 16.6

Abstract Image

查看原文
分享 分享
微信好友 朋友圈 QQ好友 复制链接
本刊更多论文
求助全文
约1分钟内获得全文 去求助
来源期刊
Journal of Ecology
Journal of Ecology 环境科学-生态学
CiteScore
10.90
自引率
5.50%
发文量
207
审稿时长
3.0 months
期刊介绍: Journal of Ecology publishes original research papers on all aspects of the ecology of plants (including algae), in both aquatic and terrestrial ecosystems. We do not publish papers concerned solely with cultivated plants and agricultural ecosystems. Studies of plant communities, populations or individual species are accepted, as well as studies of the interactions between plants and animals, fungi or bacteria, providing they focus on the ecology of the plants. We aim to bring important work using any ecological approach (including molecular techniques) to a wide international audience and therefore only publish papers with strong and ecological messages that advance our understanding of ecological principles.
期刊最新文献
Simplification of woody plant trait networks among communities along a climatic aridity gradient Leaf and root economics space in Fraxinus mandshurica: A test of the multidimensional trait framework within species Andean grassland stability across spatial scales increases with camelid grazing intensity despite biotic homogenization Unveiling above- and below-ground ecological strategies that underlie woody plant encroachment in grasslands The afterlife effects of leaf and root litter traits on soil N cycling
×
引用
GB/T 7714-2015
复制
MLA
复制
APA
复制
导出至
BibTeX EndNote RefMan NoteFirst NoteExpress
×
×
提示
您的信息不完整,为了账户安全,请先补充。
现在去补充
×
提示
您因"违规操作"
具体请查看互助需知
我知道了
×
提示
现在去查看 取消
×
提示
确定
0
微信
客服QQ
Book学术公众号 扫码关注我们
反馈
×
意见反馈
请填写您的意见或建议
请填写您的手机或邮箱
已复制链接
已复制链接
快去分享给好友吧!
我知道了
×
扫码分享
扫码分享
Book学术官方微信
Book学术文献互助
Book学术文献互助群
群 号:481959085
Book学术
文献互助 智能选刊 最新文献 互助须知 联系我们:info@booksci.cn
Book学术提供免费学术资源搜索服务,方便国内外学者检索中英文文献。致力于提供最便捷和优质的服务体验。
Copyright © 2023 Book学术 All rights reserved.
ghs 京公网安备 11010802042870号 京ICP备2023020795号-1