T. G. Cooper, B. Hellenkemper, J. Jonckheere, N. Callewaert, A. J. Grootenhuis, W. M. Kersemaekers, A. Leung, C. Wang
{"title":"Azoospermia: Virtual Reality or Possible to Quantify?","authors":"T. G. Cooper, B. Hellenkemper, J. Jonckheere, N. Callewaert, A. J. Grootenhuis, W. M. Kersemaekers, A. Leung, C. Wang","doi":"10.2164/jandrol.05210","DOIUrl":null,"url":null,"abstract":"<p>Three sperm-counting methods were compared within and between 3 centers to determine the sensitivity and reproducibility of assessing low sperm concentrations. Two methods were performed by phase contrast microscopy with and without centrifugation, and 1 method was performed by fluorescence microscopy (using the DNA stain Hoechst 33342) without centrifugation. Semen samples were serially diluted in fluorescent dye-containing fixative, and sperm concentrations were assessed in duplicate in the central field (100 nL) of reusable Neubauer chambers (phase contrast microscopy), in the whole field of disposable 25-μL Leja chambers (fluorescence microscopy), and in wet preparations (up to 1950 microscopic fields) of the pellet obtained after centrifugation at 3000 × <i>g</i> for 15 minutes (phase contrast microscopy). Agreement among the 3 participating centers was good, with lower limits of quantification (the concentrations for which counting errors [the standard error of the number of spermatozoa counted expressed as a percentage of the count] are ≤20%) determined to be 150 000 /mL for the Neubauer chamber (phase contrast microscopy) and 500/mL for the Leja chamber (fluorescence microscopy). These are equivalent to 300 000 /mL and 1000 /mL for undiluted semen. The centrifugation method consistently, seriously, and significantly underestimated mean sperm concentration compared with the other 2 methods by an average of 49%. In conclusion, the accurate measurement of low sperm counts is facilitated by the use of large-volume chambers and fluorescence microscopy, and this permits the definition of lower limits of sperm concentrations for azoospermic samples.</p><p>The absence of spermatozoa from the ejaculate has always been an important criterion for diagnosing infertility, for proving success of vasectomy, and currently for determining the efficacy of hormonal contraception. Its assessment, however, has never been easy, for reasons relating to the methodology and counting errors at very low sperm concentrations. Despite calls for a change in the definition of azoospermia to include its etiology, treatment, and prognosis (Sharif, 2000; Ezeh and Moore, 2001), in the andrology laboratory it remains a description of the semen analyzed, that is, the absence of spermatozoa from an ejaculate (World Health Organization [WHO], 1999). However, given the problems of measuring low sperm numbers, it is appropriate to reassess its definition in statistical terms and provide the sensitivity of methods routinely used to assess this condition so that the diagnoses and prognoses alluded to above can be performed from good evidence.</p><p>It is generally accepted that “should only a few or no spermatozoa be seen at initial evaluation, the sample must be centrifuged and the sediment examined for spermatozoa. The term azoospermia can only be used if no spermatozoa have been found in the sediment” (Eliasson, 1981). Where centrifugation has been used to concentrate the few spermatozoa found in semen samples, different techniques have been used. After centrifuging semen at 200 × <i>g</i> for 10 minutes, discarding the supernatant, and evaluating the whole pellet (1500 × high-power fields), Jaffe et al (1998) found that 18.6% of men with “obstructive azoospermia” and 22.8% of men with “non-obstructive azoospermia,” as judged before centrifugation, had spermatozoa in the pellet.</p><p>In his book <i>Practical Laboratory Andrology</i>, Mortimer (1994) suggests centrifugation at 1000 × <i>g</i> for 15 minutes, and the Nordic Association for Andrology (NAFA)—ESHRE-SIGA semen analysis manual (NAFA and ESHRE-SIGA, 2002) suggests at least 1000 × <i>g</i> for 15 minutes. Lindsay et al (1995) demonstrated a dramatic increase in the appearance of spermatozoa in the pellet with both increasing time (10–15 minutes) and speed (600–3600 × <i>g</i>) of centrifugation. The current WHO manual (WHO, 1999) suggests centrifugation at 600 × <i>g</i> for 15 minutes to concentrate samples with low sperm counts (fewer than 1–2 per 400 × field) and less than 3000 × <i>g</i> for 15 minutes of all samples in which no spermatozoa are detected. Such high speeds may be useful for increasing the certainty of confirming successful vasectomy but are likely to damage the spermatozoa subsequently required for assisted reproductive technologies, though this has been challenged (Ezeh and Moore, 2001). Recently, Corea et al (2005) centrifuged 25 semen samples from “azoospermic men” and found no sperm in the pellets produced at 600 × <i>g</i> for 10 minutes but detected spermatozoa in the 600 × <i>g</i> supernatants when centrifuged at 1000 × <i>g</i> for 15 minutes. Because no more sperm-containing samples were detected by centrifuging the 1000 × <i>g</i> supernatant at 3000 × <i>g</i> for 15 minutes, the authors concluded that a minimum of 1000 × <i>g</i> for 15 minutes was adequate for the detection of azoospermia.</p><p>Interestingly, Corea et al (2005) also showed that centrifugation at 3000 × <i>g</i> for 15 minutes did not remove spermatozoa from the supernatant of 23 of 25 normozoospermic samples. This renders uncertain the accuracy of any centrifugation less than 3000 × <i>g</i> for pelleting all the spermatozoa in the ejaculate. The discrepancy between these reports and the vagueness of centrifugation forces (because of the terms “at least” and “less than”) is worrying, and replication of results among laboratories using different centrifugal forces is unlikely to be consistent.</p><p>Centrifugation is followed by examination of the sperm pellet in wet preparations under coverslips. If the WHO (1999) directive is taken literally (“only when no spermatozoa are found after a complete and systematic search of all of the resuspended precipitate should samples be classified as azoospermic”), a large number of microscopic fields needs to be assessed; for example, Jaffe et al (1998) counted 1500 fields. For a 22- × 22-mm coverslip and field of view 500 μm in diameter (40 × objective), a complete scan along an edge of the coverslip is about 44 fields, and the whole coverslip is 1936 fields. If the total pellet were 100 μL, 10 such coverslips, or about 20 000 fields, would have to be scanned, which is both time consuming and eye straining. If the entire semen sample is centrifuged, there is additional interference of sperm visualization by pelleted debris. If the whole semen sample is not analyzed, the aliquot taken for centrifugation may not be representative.</p><p>An alternative to centrifugation is to evaluate larger volumes by either preparing more chambers or using chambers of inherently larger volume. The Neubauer chamber consists of 9 fields, of which the central square (with 25 smaller squares, 100 nL) is usually used, but use of the entire ruled area on both sides increases the sampled volume to 1.8 μL. Chambers of far larger volume are currently being produced, and in this report the new 100-μm deep, 25-μL volume Leja chamber (Leja, Nieuw-Vennep, The Netherlands) is used.</p><p>Irrespective of the samples examined, spermatozoa may be present in samples where none are seen, as the upper confidence limit of zero in the Poisson distribution is 3.7 per unit volume. The number of spermatozoa that may be present in a sample considered to be azoospermic depends on the volume of the sample examined. The Table shows the theoretical numbers of spermatozoa that could be present in various counting chambers when none are observed. The numbers vary from 148 to 370 000 spermatozoa, depending on chamber volume, but are associated with a counting error of 52%. The lower limit of detection (LLOD), the theoretical sperm concentration in undiluted semen providing at least 1 spermatozoon per chamber, is also given in the Table and varies from 40 to 100 000 spermatozoa/mL. The counting error for a count of 1 is 100%.</p><p>Because counting errors decrease the more spermatozoa that are observed, for an acceptable error (duplicates agreeing 95% of the time) it is often recommended that at least 200 spermatozoa be counted. For a semen concentration of 1 million/mL, considered a necessary endpoint for contraception (Sixth Summit Meeting Consensus, 2002), 1 + 4 dilutions generate unacceptably high counting errors with some chambers, but with 1 + 1 dilutions the greater number of spermatozoa per chamber reduces the counting error accordingly (Table). The theoretical lower limit of quantification (LLOQ), the lowest sperm concentrations delivering an acceptable counting error (and taking this to be 10%), ranges from 4000 to 10 000 000/mL, with the chambers housing the smallest and largest volumes, respectively. However, a higher counting error (20%) is acceptable for LLOQ (Shah et al, 2000), and these values range from 1000 to 3 000 000/mL. These figures make obvious the inadequacy of chambers with small volumes, or counting a small number of fields in wet preparations, for assessing azoospermia and make clear the benefits of using large-volume chambers.</p><p>The fluorescent dye Hoechst 33342 is used for sorting X- and Y-bearing sperm on the basis of their different DNA content (Johnson et al, 2005), in computer-assisted semen analysis for the quantification of live and dead sperm (Farrell et al, 1996), and to eliminate the overestimation of low sperm concentrations (Zinaman et al, 1996). In this study, different counting chambers (the improved Neubauer and Leja) and different assessment methods (phase contrast and fluorescence microscopy) were compared with a centrifugation method on the same fixed and serially diluted semen samples in 3 different laboratories to determine experimentally the sensitivity and reproducibility of each method.</p><p>The 3 centers included 2 from academic health centers (the andrology laboratories at the Institute of Reproductive Medicine, Münster, Germany; and the Division of Endocrinology, Department of Medicine, Harbor-UCLA Medical Center, Torrance, Calif) and 1 commercial reference laboratory (the Bio Analytical Research Corporation [BARC] n.v., Ghent, Belgium). All 3 participating centers recruited 5 sperm donors, either healthy volunteers or patients visiting the fertility center, and sperm concentrations were determined according to WHO (1999). Based on these initial concentrations, 10-fold dilutions from 1 × 10<sup>6</sup>/mL were prepared, resulting in 5 diluted samples per sperm donor (range 1 × 10<sup>6</sup> cells/mL to 100 cells/mL). Samples were diluted in the formalin fixative described in the WHO manual (WHO, 1999) with added Hoechst 33342 bisbenzimide fluorochrome (1 mg/L; Sigma-Aldrich Co, Cat No. B-2261, Tiefenbach, Germany). This diluent was prepared by the BARC and was distributed to the other 2 participating centers. The dilutions were made and sample codes were designated by a different technician from the one performing the counts. In the ring test, the semen dilutions were carefully divided into 3 identical aliquots of about 1 mL and were stored at 2°C to 8°C until shipment (<2 weeks) or analysis. Upon receipt, samples were stored in the refrigerator (2°C–8°C) until they were analyzed (within 4 weeks after arrival).</p><p>The BARC measured 10 samples diluted to the same extent to monitor recovery and sent another 10 diluted samples to the other 2 centers for measurement by Neubauer (phase contrast) and Leja (fluorescence) chambers and centrifugation (ring test). These 2 centers (Münster and Harbor-UCLA) measured these 10 samples as well as their own 25 diluted samples and the 25 diluted samples from the other center (total of 60 samples). The concentrations of sperm suspensions were assessed in duplicate by a technician unaware of the dilutions. Comparisons were made between the Neubauer chamber (phase contrast microscopy: procedure A) and Leja chamber (fluorescence microscopy: procedure B). These 2 centers also assessed the 60 samples with the centrifugation method (procedure C). Recoveries of the anticipated counts were calculated at each step of dilution from the measured sperm numbers and the dilution applied to that sample.</p><p>Neubauer chambers were mounted with thick coverslips to achieve the correct depth of chamber by ensuring that interference patterns (“Newton's rings” or iridescence lines) were seen between the glass surfaces at points of contact. For chambers with ground glass pillars, sufficient water was added to the pillars to anchor the coverslip (Brazil et al, 2004). The samples were mixed for at least 10 seconds (on a vortex mixer, maximum speed) immediately before filling the counting chamber. After mixing, an aliquot of 6 to 10 μL was taken with a pipette to 1 side of the hemocytometer to fill the area under the coverslip. A second aliquot of mixed sample was taken to fill the other side for the duplicate reading. The chamber was left for 10 to 15 minutes in a humid box to allow the spermatozoa to sediment to the grid of the counting chamber.</p><p>The number of spermatozoa was counted with a 20 × to 40 × phase contrast objective in the large central field. The number of squares to be counted was determined (WHO, 1999) so that typically 200 sperm cells could be counted in each chamber, which is sufficient for a comparison between the 2 counts. Only spermatozoa whose heads were located on the upper or left limiting lines were counted as in the square. The counts from the 2 aliquots were compared as described in the NAFA and ESHRE handbook (NAFA and ESHRE-SIGA, 2002) using the sum and difference between the 2 counts. Assessments were accepted if the difference between the 2 counts was equal to or less than the values obtained by chance, given by the Poisson distribution. If not, samples were vortexed again and 2 new chambers were refilled. The sperm concentration was obtained by dividing the sum of the 2 counts by the volume represented by each square (4 nL) and the total number of squares counted (50) (sperm/nL or millions/mL). The time required for assessing both sides of the chamber was about 5 minutes.</p><p>Samples were vortexed for at least 10 seconds immediately before filling the Leja counting chamber. After mixing, an aliquot of 25 μL allowed to fill 1 side of the Leja slide before the second aliquot was vortexed and loaded in the other side. The chambers were left for 10 to 15 minutes in a humid box, protected from light, to allow the sperm to sediment. The Leja slide was examined with a fluorescence microscope (BX-40 or BH-2 Olympus Optical, Japan) with a DM400 dichroic mirror and BA420 barrier filter with a 25 × fluorescence objective. A sufficient number of microscopic fields was assessed so that at least 200 cells were counted per chamber. In case of low sperm counts, a systematic count of the entire Leja chamber was performed by scanning along the x-axis from side to side and in the y-axis in steps of 1 aperture width in a zigzag motion so as to cover the entire coverslip. Scanning was aided by using the notched edges of the chamber for correct location of the scanned fields. Despite the large volume, scanning could be fairly fast because spermatozoa presented themselves as bright fluorescent points (more condensed nuclei), as opposed to leucocytes, which have more diffuse fluorescence (larger nuclei). Samples were read before drying out, or chambers were sealed with nail polish to prevent drying out. Doubts about the source of a fluorescent signal could easily be clarified by switching to phase contrast optics where the sperm tail could be seen. For each sample, both sides of a Leja chamber were counted, the counts were summed, and duplicate assessments were accepted as for procedure A.</p><p>For computation of concentration, the volume of each microscopic field (nL) was determined from the diameter of the aperture (measured by a reticule), the area (π · <i>r</i><sup>2</sup>), and the depth of the Leja chamber (100 μm). The sperm concentration was calculated by dividing the sum of the 2 counts by the volume within the number of microscopic fields examined (sperm/μL). The time required for assessing both sides of the chamber could be up to 15 minutes with very low counts.</p><p>The entire sample was thoroughly vortexed for 10 seconds and an aliquot of 100 to 500 μL was centrifuged at 3000 × <i>g</i> for 15 minutes. The supernatant was gently removed to leave a pellet of approximately (but measured) 25 μL. Two 7-μL aliquots were covered with 18- × 18-mm coverslips (or 10 μL with 22- × 22-mm coverslips), and each duplicate was scanned systematically in a zigzag path (see above) for about 300 fields or until 200 sperm were counted. The whole coverslip (about 1950 fields) was scanned when no spermatozoa were observed. The number of spermatozoa was counted, and the number of fields in which they were seen was registered. The volume of each microscopic field (nL) was determined as above assuming a depth of 20 μm.</p><p>The sperm number in the pellet was calculated from the number of sperm counted in the volume occupied by the number of fields counted (sperm/μL) multiplied by the volume of the pellet. This was corrected for by the volume of sample centrifuged to yield the pellet (sperm/mL of the original sample). The time required for assessing both sides of the chamber could be up to 15 minutes with very low counts.</p><p>Results are presented as percentage recovery of the anticipated sperm counts or as sperm concentrations. Counting errors are necessarily high when the number of sperm counted is low, but it was decided to accept errors if they were less than or equal to 10% and less than or equal to 20% (Shah et al, 2000). Linear regression analysis was applied between centers for each method and for each method against another. The signed rank test was used to distinguish differences among methods. Differences were accepted as significant when <i>P</i> < .05. This was performed by SigmaStat version 3.1 (Erkrath, Germany).</p><p>Analysis of 5 different samples serially diluted (10-fold) from about 1 million/mL revealed that spermatozoa could be observed in the first 3 dilutions by using phase contrast microscopy only (Neubauer chamber), whereas spermatozoa were observed at all 5 dilutions by the fluorescence method (Leja chamber) (Figure 1). Recovery of spermatozoa in the different dilutions in the 3 centers from the 10 samples varied between 0% and 95% for the phase contrast method (Neubauer chamber) and between 16% and 104% for the fluorescence method (Leja chamber) (Figure 1). In a larger comparison of 50 samples read by 2 centers, the fluorescence method was again satisfactory after the second dilution, whereas the centrifugation method was clearly shown to be inadequate at this step (Figure 1).</p><p>For the 10 samples measured by all 3 centers in the ring test, a good overall agreement between the phase contrast (Neubauer chamber) and fluorescence (Leja chamber) methods was demonstrated. A linear regression between values obtained by both methods was obtained, but below a concentration of 7500 sperm/mL (assessed by the fluorescence method) no spermatozoa were detected in the Neubauer chamber; thus, an LLOD for the Neubauer chamber as used here was about 10 000 spermatozoa/mL (Figure 2, upper panel). By contrast, the fluorescence method was determined to be linear down to fewer than 100 sperm/mL by all 3 centers (Figure 2, lower panel). Direct comparison of the results obtained by both methods (Figure 3) revealed a good agreement between the 2 methods over a wide concentration range, with linear regression coefficients of 0.994, 0.997, and 0.995 obtained by centers 1, 2 and 3. The superiority of the fluorescence method was demonstrated at low concentrations (Figure 4) as large deviation of the values derived from the Neubauer chamber occurred around 10 000 spermatozoa/mL.</p><p>Sixty diluted semen samples were analyzed by 3 methods, namely, the Neubauer and Leja chambers and after centrifugation and examination of the pellet in wet preparations. Excellent agreement between the centers was demonstrated for sperm concentrations measured by phase contrast microscopy (Neubauer chamber: <i>R</i> = 0.966) and fluorescence microscopy (Leja chamber: <i>R</i> = 0.995), but less agreement between centers was shown for concentrations assessed after centrifugation (wet preparations: <i>R</i> = 0.812). The combined results from both centers revealed a better agreement between fluorescence and phase contrast microscopy results (<i>R</i> = 0.987) than between fluorescence and centrifugation results (<i>R</i> = 0.883).</p><p>Agreement between the fluorescence and phase contrast methods was shown below 1 million spermatozoa/mL by the regression line closely paralleling the line of identity, but deviation from it was observed at concentrations below 10 000/mL. Values from the Neubauer chamber then reached the LLOD, leading to an overestimation of the concentration compared with the Leja chamber (Figures 3 and 4). The results from the centrifugation method were widely divergent from those of the Leja chamber at all concentrations tested and indicated consistent underestimation (Figure 4). The signed rank test revealed significantly lower median concentrations assessed by centrifugation (wet preparation: 3180/mL) than those assessed by both phase contrast microscopy (Neubauer chamber: 10 000/mL) and fluorescence microscopy (Leja chamber: 9460/mL). Mean concentrations estimated from the sperm pellet were only 49% and 53% of those generated by the Neubauer (phase contrast) and Leja (fluorescence) methods, respectively.</p><p>The mean counting errors associated with the sperm concentrations estimated by the 3 methods are presented in Figure 5. This figure shows the anticipated increase in counting error with fewer sperm counted in samples of low concentration, and that with the Neubauer chamber concentrations below 100 000/mL cannot be estimated with precision below 20%. Intercepts of the curves with the 10% and 20% error axes revealed sensitivities (spermatozoa/mL) of 500 000 and 150 000 for the Neubauer chamber, 2000 and 500 for the Leja chamber, and 300 and 60 for the sperm pellet method. For samples diluted 1:1 (as required for the fluorescence method), these limits are equivalent to 1 000 000 (300 000) spermatozoa/mL and 4000 (1000) spermatozoa/mL in undiluted semen for the 2 chambers, respectively. The lowest value for the centrifugation method does not reflect a high sensitivity; rather, it indicates that up to 70% of the spermatozoa were lost by this procedure.</p><p>The diagnosis of azoospermia is hazardous because from a statistical viewpoint it does not exist; the Poisson distribution indicates that 3.7 spermatozoa could be present in any field when none are seen. Furthermore, to achieve acceptable counting accuracy, at least 200 cells need to be counted, and such samples are clearly not azoospermic. Nevertheless, it is an important assessment to make for providing proof of success of vasectomy and for monitoring the severity of spermatogeneic inhibition by hormonal male contraception. In this study, the commonly used Neubauer improved counting chamber central square (100 μm deep, 100 nL) and a Leja large-volume chamber (100 μm deep, 25 μL) were compared with a centrifugation method for assessing low sperm concentrations in serially diluted specimens.</p><p>Although centrifugation of semen is often recommended and routinely used by an andrology laboratory, the centrifugal forces that are used differ among laboratories, and some methods are vague as to the exact requirements. This most likely leads to discrepancies among centers, though no quality control of azoospermic samples seems to have been made by external quality control programs. Furthermore, the difficulty in identifying spermatozoa within material pelleted from seminal plasma makes long scrutiny necessary. In the present study, the centrifugation method consistently underestimated the true concentrations in the sample, as judged from the methods avoiding centrifugation. This could be due to the unrepresentative sampling of the aliquot centrifuged or the inhomogeneous pellet, making visualization of spermatozoa poor without fluorescence labeling. It could also reflect the failure of the centrifugation procedure (3000 × <i>g</i> for 15 minutes) to pellet all the spermatozoa, as indicated by Lindsay et al (1995) and Corea et al (2005). The centrifugation procedure described here, and probably elsewhere, is inadequate for accurate determination of sperm concentration.</p><p>Although routine semen processing has been shown to be inadequate for indicating azoospermia (Jaffe et al, 1998; Corea et al, 2005), the sensitivities of the methods used have not been established. Routine semen handling according to WHO (1999) involves diluting semen, with the lowest dilution (1:25) suggested for samples with fewer than 15 spermatozoa per high-power field. The act of diluting compounds the problem of finding the occasional rare spermatozoon and may well be unnecessary when sperm numbers are so low. The lower limits of quantification (concentrations providing acceptable errors of ≤20%) determined in this study for the 2 methods were found to be about 150 000 /mL for the Neubauer chamber and 500/mL for the Leja chamber, which agree with theoretical values. For samples diluted 1:1 (as required for the fluorescence method), these limits are equivalent to 300 000 /mL and 1000/mL in undiluted semen, respectively. The sensitivity of the Neubauer method could be improved ninefold by examining the whole ruled area of the chamber (9 fields, 900 nL per chamber) and clearly was improved by use of the larger, disposable Leja chamber.</p><p>The benefit of viewing larger semen volumes (the increased chance of finding sufficient spermatozoa for acceptable counting errors) has to be offset by the longer time necessary to scan the larger microscopic areas. By introducing a fluorescent DNA dye, the appearance of spermatozoa as bright fluorescent points of light makes their recognition easier and the assessment quicker. Although other cell types also take up the stain, their nuclei are fainter and the staining is more diffuse, for the nuclei are larger (Zinaman et al, 1996). Being able to turn to phase contrast optics to confirm that a sperm tail is present is an additional benefit. Therefore, in current practice, all cells counted as sperm cells are sperm cells and no additional error is introduced by fluorescence microscopy.</p><p>In summary, centrifugation of semen samples significantly underestimates the concentration of spermatozoa in any sample considered azoospermic. The use of a Neubauer chamber, utilizing the central field of the slide, permits measurements down to 150 000 spermatozoa/mL of 1:1 diluted sample with acceptable counting errors, equivalent to 300 000/mL of undiluted semen. This sensitivity could be increased by assessing all 9 microscopic fields without loss of precision. The use of a disposable Leja 25-μL chamber provided the higher sensitivity of the chambers tested, equivalent to 1000 spermatozoa/mL of undiluted semen. It is suggested that the results of azoospermia be qualified by the sensitivity of the assay method used, as for other analytes. Thus, providing a 1:1 dilution of semen made “nondetectable” would be fewer than 300 000/mL for the Neubauer chamber (central square), fewer than 30 000/mL for the Neubauer chamber (all 9 fields), and fewer than 1000/mL for the Leja chamber.</p>","PeriodicalId":15029,"journal":{"name":"Journal of andrology","volume":"27 4","pages":"483-490"},"PeriodicalIF":0.0000,"publicationDate":"2013-01-02","publicationTypes":"Journal Article","fieldsOfStudy":null,"isOpenAccess":false,"openAccessPdf":"https://sci-hub-pdf.com/10.2164/jandrol.05210","citationCount":"36","resultStr":null,"platform":"Semanticscholar","paperid":null,"PeriodicalName":"Journal of andrology","FirstCategoryId":"1085","ListUrlMain":"https://onlinelibrary.wiley.com/doi/10.2164/jandrol.05210","RegionNum":0,"RegionCategory":null,"ArticlePicture":[],"TitleCN":null,"AbstractTextCN":null,"PMCID":null,"EPubDate":"","PubModel":"","JCR":"","JCRName":"","Score":null,"Total":0}
引用次数: 36
Abstract
Three sperm-counting methods were compared within and between 3 centers to determine the sensitivity and reproducibility of assessing low sperm concentrations. Two methods were performed by phase contrast microscopy with and without centrifugation, and 1 method was performed by fluorescence microscopy (using the DNA stain Hoechst 33342) without centrifugation. Semen samples were serially diluted in fluorescent dye-containing fixative, and sperm concentrations were assessed in duplicate in the central field (100 nL) of reusable Neubauer chambers (phase contrast microscopy), in the whole field of disposable 25-μL Leja chambers (fluorescence microscopy), and in wet preparations (up to 1950 microscopic fields) of the pellet obtained after centrifugation at 3000 × g for 15 minutes (phase contrast microscopy). Agreement among the 3 participating centers was good, with lower limits of quantification (the concentrations for which counting errors [the standard error of the number of spermatozoa counted expressed as a percentage of the count] are ≤20%) determined to be 150 000 /mL for the Neubauer chamber (phase contrast microscopy) and 500/mL for the Leja chamber (fluorescence microscopy). These are equivalent to 300 000 /mL and 1000 /mL for undiluted semen. The centrifugation method consistently, seriously, and significantly underestimated mean sperm concentration compared with the other 2 methods by an average of 49%. In conclusion, the accurate measurement of low sperm counts is facilitated by the use of large-volume chambers and fluorescence microscopy, and this permits the definition of lower limits of sperm concentrations for azoospermic samples.
The absence of spermatozoa from the ejaculate has always been an important criterion for diagnosing infertility, for proving success of vasectomy, and currently for determining the efficacy of hormonal contraception. Its assessment, however, has never been easy, for reasons relating to the methodology and counting errors at very low sperm concentrations. Despite calls for a change in the definition of azoospermia to include its etiology, treatment, and prognosis (Sharif, 2000; Ezeh and Moore, 2001), in the andrology laboratory it remains a description of the semen analyzed, that is, the absence of spermatozoa from an ejaculate (World Health Organization [WHO], 1999). However, given the problems of measuring low sperm numbers, it is appropriate to reassess its definition in statistical terms and provide the sensitivity of methods routinely used to assess this condition so that the diagnoses and prognoses alluded to above can be performed from good evidence.
It is generally accepted that “should only a few or no spermatozoa be seen at initial evaluation, the sample must be centrifuged and the sediment examined for spermatozoa. The term azoospermia can only be used if no spermatozoa have been found in the sediment” (Eliasson, 1981). Where centrifugation has been used to concentrate the few spermatozoa found in semen samples, different techniques have been used. After centrifuging semen at 200 × g for 10 minutes, discarding the supernatant, and evaluating the whole pellet (1500 × high-power fields), Jaffe et al (1998) found that 18.6% of men with “obstructive azoospermia” and 22.8% of men with “non-obstructive azoospermia,” as judged before centrifugation, had spermatozoa in the pellet.
In his book Practical Laboratory Andrology, Mortimer (1994) suggests centrifugation at 1000 × g for 15 minutes, and the Nordic Association for Andrology (NAFA)—ESHRE-SIGA semen analysis manual (NAFA and ESHRE-SIGA, 2002) suggests at least 1000 × g for 15 minutes. Lindsay et al (1995) demonstrated a dramatic increase in the appearance of spermatozoa in the pellet with both increasing time (10–15 minutes) and speed (600–3600 × g) of centrifugation. The current WHO manual (WHO, 1999) suggests centrifugation at 600 × g for 15 minutes to concentrate samples with low sperm counts (fewer than 1–2 per 400 × field) and less than 3000 × g for 15 minutes of all samples in which no spermatozoa are detected. Such high speeds may be useful for increasing the certainty of confirming successful vasectomy but are likely to damage the spermatozoa subsequently required for assisted reproductive technologies, though this has been challenged (Ezeh and Moore, 2001). Recently, Corea et al (2005) centrifuged 25 semen samples from “azoospermic men” and found no sperm in the pellets produced at 600 × g for 10 minutes but detected spermatozoa in the 600 × g supernatants when centrifuged at 1000 × g for 15 minutes. Because no more sperm-containing samples were detected by centrifuging the 1000 × g supernatant at 3000 × g for 15 minutes, the authors concluded that a minimum of 1000 × g for 15 minutes was adequate for the detection of azoospermia.
Interestingly, Corea et al (2005) also showed that centrifugation at 3000 × g for 15 minutes did not remove spermatozoa from the supernatant of 23 of 25 normozoospermic samples. This renders uncertain the accuracy of any centrifugation less than 3000 × g for pelleting all the spermatozoa in the ejaculate. The discrepancy between these reports and the vagueness of centrifugation forces (because of the terms “at least” and “less than”) is worrying, and replication of results among laboratories using different centrifugal forces is unlikely to be consistent.
Centrifugation is followed by examination of the sperm pellet in wet preparations under coverslips. If the WHO (1999) directive is taken literally (“only when no spermatozoa are found after a complete and systematic search of all of the resuspended precipitate should samples be classified as azoospermic”), a large number of microscopic fields needs to be assessed; for example, Jaffe et al (1998) counted 1500 fields. For a 22- × 22-mm coverslip and field of view 500 μm in diameter (40 × objective), a complete scan along an edge of the coverslip is about 44 fields, and the whole coverslip is 1936 fields. If the total pellet were 100 μL, 10 such coverslips, or about 20 000 fields, would have to be scanned, which is both time consuming and eye straining. If the entire semen sample is centrifuged, there is additional interference of sperm visualization by pelleted debris. If the whole semen sample is not analyzed, the aliquot taken for centrifugation may not be representative.
An alternative to centrifugation is to evaluate larger volumes by either preparing more chambers or using chambers of inherently larger volume. The Neubauer chamber consists of 9 fields, of which the central square (with 25 smaller squares, 100 nL) is usually used, but use of the entire ruled area on both sides increases the sampled volume to 1.8 μL. Chambers of far larger volume are currently being produced, and in this report the new 100-μm deep, 25-μL volume Leja chamber (Leja, Nieuw-Vennep, The Netherlands) is used.
Irrespective of the samples examined, spermatozoa may be present in samples where none are seen, as the upper confidence limit of zero in the Poisson distribution is 3.7 per unit volume. The number of spermatozoa that may be present in a sample considered to be azoospermic depends on the volume of the sample examined. The Table shows the theoretical numbers of spermatozoa that could be present in various counting chambers when none are observed. The numbers vary from 148 to 370 000 spermatozoa, depending on chamber volume, but are associated with a counting error of 52%. The lower limit of detection (LLOD), the theoretical sperm concentration in undiluted semen providing at least 1 spermatozoon per chamber, is also given in the Table and varies from 40 to 100 000 spermatozoa/mL. The counting error for a count of 1 is 100%.
Because counting errors decrease the more spermatozoa that are observed, for an acceptable error (duplicates agreeing 95% of the time) it is often recommended that at least 200 spermatozoa be counted. For a semen concentration of 1 million/mL, considered a necessary endpoint for contraception (Sixth Summit Meeting Consensus, 2002), 1 + 4 dilutions generate unacceptably high counting errors with some chambers, but with 1 + 1 dilutions the greater number of spermatozoa per chamber reduces the counting error accordingly (Table). The theoretical lower limit of quantification (LLOQ), the lowest sperm concentrations delivering an acceptable counting error (and taking this to be 10%), ranges from 4000 to 10 000 000/mL, with the chambers housing the smallest and largest volumes, respectively. However, a higher counting error (20%) is acceptable for LLOQ (Shah et al, 2000), and these values range from 1000 to 3 000 000/mL. These figures make obvious the inadequacy of chambers with small volumes, or counting a small number of fields in wet preparations, for assessing azoospermia and make clear the benefits of using large-volume chambers.
The fluorescent dye Hoechst 33342 is used for sorting X- and Y-bearing sperm on the basis of their different DNA content (Johnson et al, 2005), in computer-assisted semen analysis for the quantification of live and dead sperm (Farrell et al, 1996), and to eliminate the overestimation of low sperm concentrations (Zinaman et al, 1996). In this study, different counting chambers (the improved Neubauer and Leja) and different assessment methods (phase contrast and fluorescence microscopy) were compared with a centrifugation method on the same fixed and serially diluted semen samples in 3 different laboratories to determine experimentally the sensitivity and reproducibility of each method.
The 3 centers included 2 from academic health centers (the andrology laboratories at the Institute of Reproductive Medicine, Münster, Germany; and the Division of Endocrinology, Department of Medicine, Harbor-UCLA Medical Center, Torrance, Calif) and 1 commercial reference laboratory (the Bio Analytical Research Corporation [BARC] n.v., Ghent, Belgium). All 3 participating centers recruited 5 sperm donors, either healthy volunteers or patients visiting the fertility center, and sperm concentrations were determined according to WHO (1999). Based on these initial concentrations, 10-fold dilutions from 1 × 10⁶/mL were prepared, resulting in 5 diluted samples per sperm donor (range 1 × 10⁶ cells/mL to 100 cells/mL). Samples were diluted in the formalin fixative described in the WHO manual (WHO, 1999) with added Hoechst 33342 bisbenzimide fluorochrome (1 mg/L; Sigma-Aldrich Co, Cat No. B-2261, Tiefenbach, Germany). This diluent was prepared by the BARC and was distributed to the other 2 participating centers. The dilutions were made and sample codes were designated by a different technician from the one performing the counts. In the ring test, the semen dilutions were carefully divided into 3 identical aliquots of about 1 mL and were stored at 2°C to 8°C until shipment (<2 weeks) or analysis. Upon receipt, samples were stored in the refrigerator (2°C–8°C) until they were analyzed (within 4 weeks after arrival).
The BARC measured 10 samples diluted to the same extent to monitor recovery and sent another 10 diluted samples to the other 2 centers for measurement by Neubauer (phase contrast) and Leja (fluorescence) chambers and centrifugation (ring test). These 2 centers (Münster and Harbor-UCLA) measured these 10 samples as well as their own 25 diluted samples and the 25 diluted samples from the other center (total of 60 samples). The concentrations of sperm suspensions were assessed in duplicate by a technician unaware of the dilutions. Comparisons were made between the Neubauer chamber (phase contrast microscopy: procedure A) and Leja chamber (fluorescence microscopy: procedure B). These 2 centers also assessed the 60 samples with the centrifugation method (procedure C). Recoveries of the anticipated counts were calculated at each step of dilution from the measured sperm numbers and the dilution applied to that sample.
Neubauer chambers were mounted with thick coverslips to achieve the correct depth of chamber by ensuring that interference patterns (“Newton's rings” or iridescence lines) were seen between the glass surfaces at points of contact. For chambers with ground glass pillars, sufficient water was added to the pillars to anchor the coverslip (Brazil et al, 2004). The samples were mixed for at least 10 seconds (on a vortex mixer, maximum speed) immediately before filling the counting chamber. After mixing, an aliquot of 6 to 10 μL was taken with a pipette to 1 side of the hemocytometer to fill the area under the coverslip. A second aliquot of mixed sample was taken to fill the other side for the duplicate reading. The chamber was left for 10 to 15 minutes in a humid box to allow the spermatozoa to sediment to the grid of the counting chamber.
The number of spermatozoa was counted with a 20 × to 40 × phase contrast objective in the large central field. The number of squares to be counted was determined (WHO, 1999) so that typically 200 sperm cells could be counted in each chamber, which is sufficient for a comparison between the 2 counts. Only spermatozoa whose heads were located on the upper or left limiting lines were counted as in the square. The counts from the 2 aliquots were compared as described in the NAFA and ESHRE handbook (NAFA and ESHRE-SIGA, 2002) using the sum and difference between the 2 counts. Assessments were accepted if the difference between the 2 counts was equal to or less than the values obtained by chance, given by the Poisson distribution. If not, samples were vortexed again and 2 new chambers were refilled. The sperm concentration was obtained by dividing the sum of the 2 counts by the volume represented by each square (4 nL) and the total number of squares counted (50) (sperm/nL or millions/mL). The time required for assessing both sides of the chamber was about 5 minutes.
Samples were vortexed for at least 10 seconds immediately before filling the Leja counting chamber. After mixing, an aliquot of 25 μL allowed to fill 1 side of the Leja slide before the second aliquot was vortexed and loaded in the other side. The chambers were left for 10 to 15 minutes in a humid box, protected from light, to allow the sperm to sediment. The Leja slide was examined with a fluorescence microscope (BX-40 or BH-2 Olympus Optical, Japan) with a DM400 dichroic mirror and BA420 barrier filter with a 25 × fluorescence objective. A sufficient number of microscopic fields was assessed so that at least 200 cells were counted per chamber. In case of low sperm counts, a systematic count of the entire Leja chamber was performed by scanning along the x-axis from side to side and in the y-axis in steps of 1 aperture width in a zigzag motion so as to cover the entire coverslip. Scanning was aided by using the notched edges of the chamber for correct location of the scanned fields. Despite the large volume, scanning could be fairly fast because spermatozoa presented themselves as bright fluorescent points (more condensed nuclei), as opposed to leucocytes, which have more diffuse fluorescence (larger nuclei). Samples were read before drying out, or chambers were sealed with nail polish to prevent drying out. Doubts about the source of a fluorescent signal could easily be clarified by switching to phase contrast optics where the sperm tail could be seen. For each sample, both sides of a Leja chamber were counted, the counts were summed, and duplicate assessments were accepted as for procedure A.
For computation of concentration, the volume of each microscopic field (nL) was determined from the diameter of the aperture (measured by a reticule), the area (π · r2), and the depth of the Leja chamber (100 μm). The sperm concentration was calculated by dividing the sum of the 2 counts by the volume within the number of microscopic fields examined (sperm/μL). The time required for assessing both sides of the chamber could be up to 15 minutes with very low counts.
The entire sample was thoroughly vortexed for 10 seconds and an aliquot of 100 to 500 μL was centrifuged at 3000 × g for 15 minutes. The supernatant was gently removed to leave a pellet of approximately (but measured) 25 μL. Two 7-μL aliquots were covered with 18- × 18-mm coverslips (or 10 μL with 22- × 22-mm coverslips), and each duplicate was scanned systematically in a zigzag path (see above) for about 300 fields or until 200 sperm were counted. The whole coverslip (about 1950 fields) was scanned when no spermatozoa were observed. The number of spermatozoa was counted, and the number of fields in which they were seen was registered. The volume of each microscopic field (nL) was determined as above assuming a depth of 20 μm.
The sperm number in the pellet was calculated from the number of sperm counted in the volume occupied by the number of fields counted (sperm/μL) multiplied by the volume of the pellet. This was corrected for by the volume of sample centrifuged to yield the pellet (sperm/mL of the original sample). The time required for assessing both sides of the chamber could be up to 15 minutes with very low counts.
Results are presented as percentage recovery of the anticipated sperm counts or as sperm concentrations. Counting errors are necessarily high when the number of sperm counted is low, but it was decided to accept errors if they were less than or equal to 10% and less than or equal to 20% (Shah et al, 2000). Linear regression analysis was applied between centers for each method and for each method against another. The signed rank test was used to distinguish differences among methods. Differences were accepted as significant when P < .05. This was performed by SigmaStat version 3.1 (Erkrath, Germany).
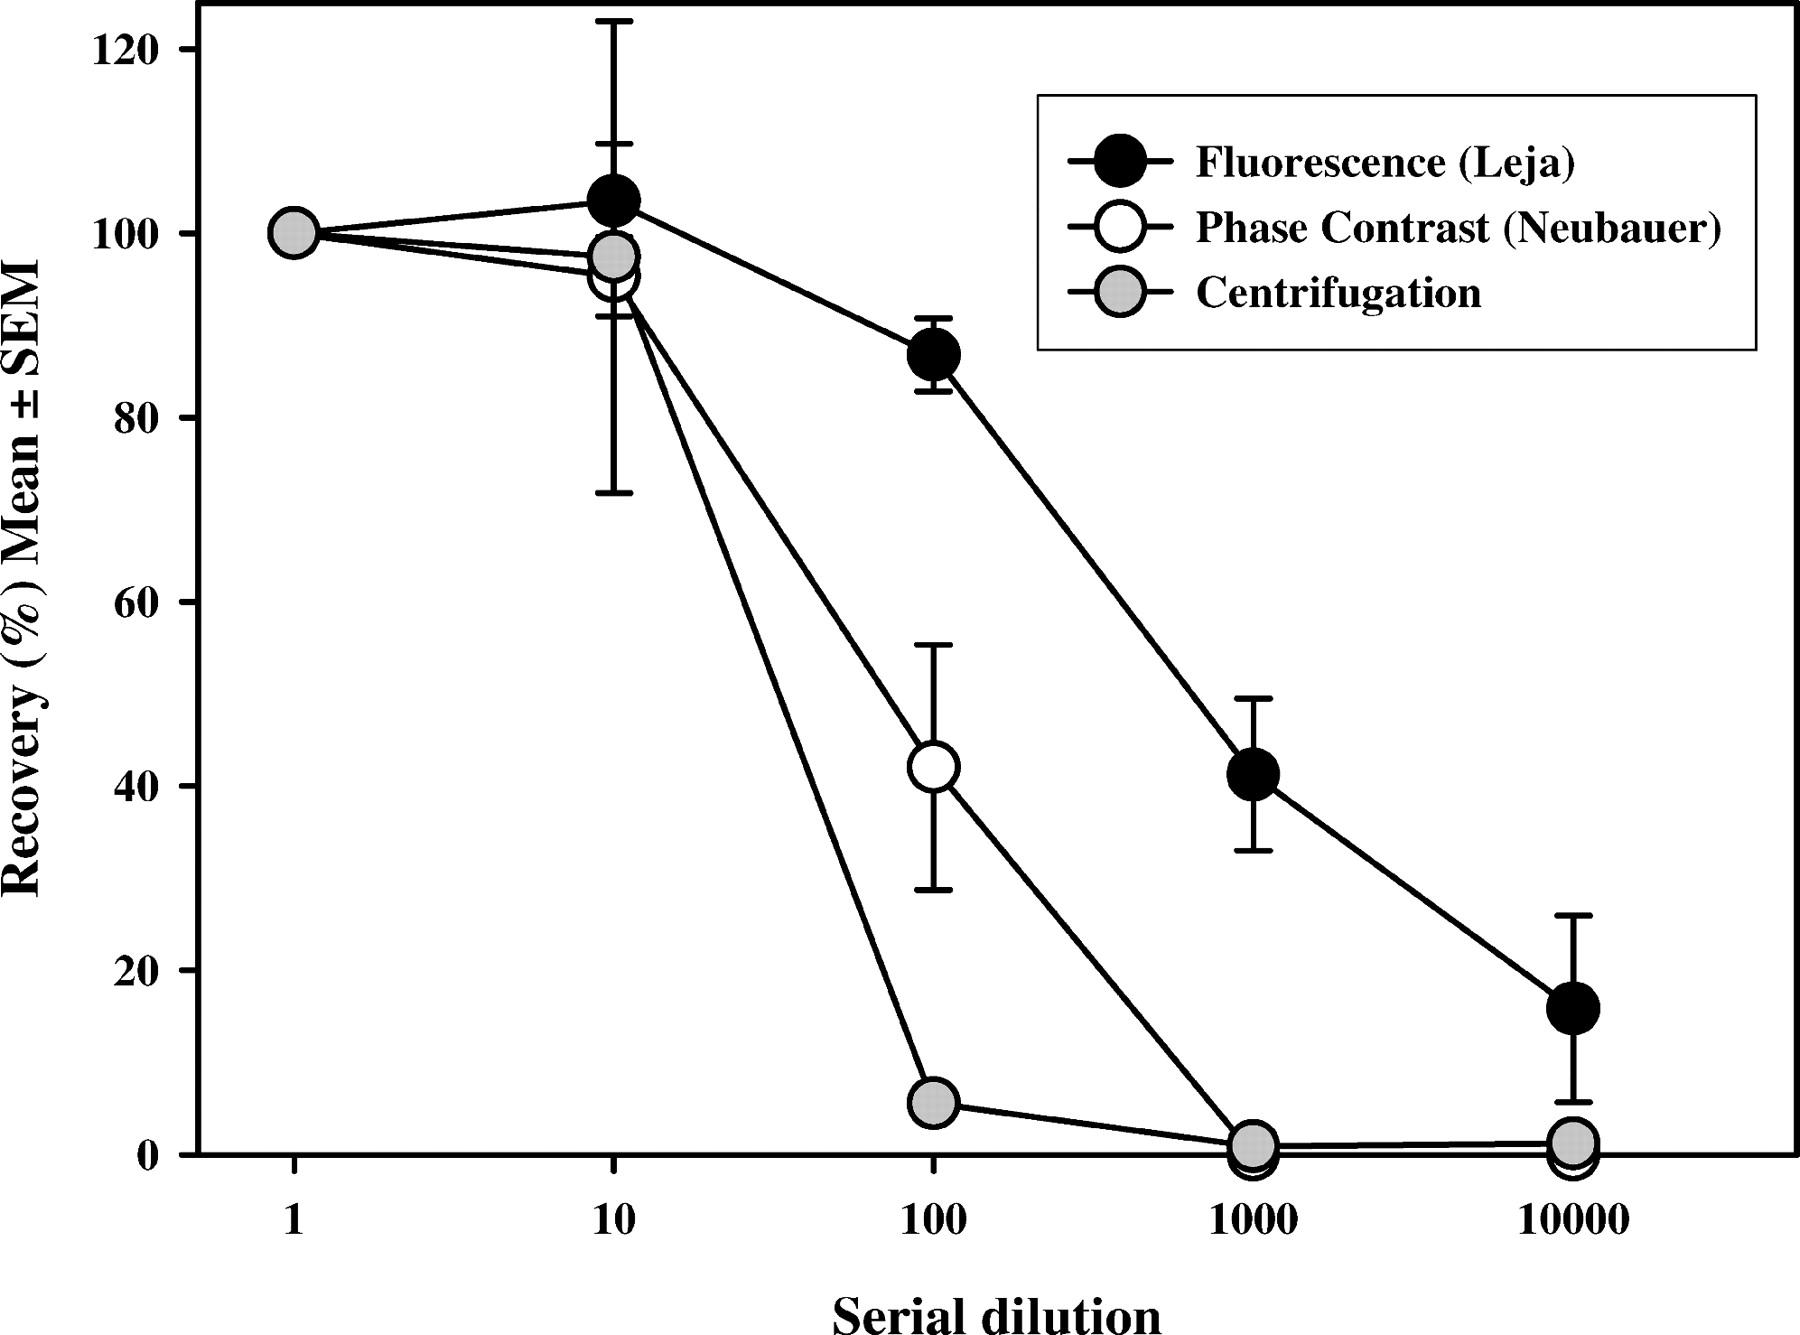
Analysis of 5 different samples serially diluted (10-fold) from about 1 million/mL revealed that spermatozoa could be observed in the first 3 dilutions by using phase contrast microscopy only (Neubauer chamber), whereas spermatozoa were observed at all 5 dilutions by the fluorescence method (Leja chamber) (Figure 1). Recovery of spermatozoa in the different dilutions in the 3 centers from the 10 samples varied between 0% and 95% for the phase contrast method (Neubauer chamber) and between 16% and 104% for the fluorescence method (Leja chamber) (Figure 1). In a larger comparison of 50 samples read by 2 centers, the fluorescence method was again satisfactory after the second dilution, whereas the centrifugation method was clearly shown to be inadequate at this step (Figure 1).
For the 10 samples measured by all 3 centers in the ring test, a good overall agreement between the phase contrast (Neubauer chamber) and fluorescence (Leja chamber) methods was demonstrated. A linear regression between values obtained by both methods was obtained, but below a concentration of 7500 sperm/mL (assessed by the fluorescence method) no spermatozoa were detected in the Neubauer chamber; thus, an LLOD for the Neubauer chamber as used here was about 10 000 spermatozoa/mL (Figure 2, upper panel). By contrast, the fluorescence method was determined to be linear down to fewer than 100 sperm/mL by all 3 centers (Figure 2, lower panel). Direct comparison of the results obtained by both methods (Figure 3) revealed a good agreement between the 2 methods over a wide concentration range, with linear regression coefficients of 0.994, 0.997, and 0.995 obtained by centers 1, 2 and 3. The superiority of the fluorescence method was demonstrated at low concentrations (Figure 4) as large deviation of the values derived from the Neubauer chamber occurred around 10 000 spermatozoa/mL.
Sixty diluted semen samples were analyzed by 3 methods, namely, the Neubauer and Leja chambers and after centrifugation and examination of the pellet in wet preparations. Excellent agreement between the centers was demonstrated for sperm concentrations measured by phase contrast microscopy (Neubauer chamber: R = 0.966) and fluorescence microscopy (Leja chamber: R = 0.995), but less agreement between centers was shown for concentrations assessed after centrifugation (wet preparations: R = 0.812). The combined results from both centers revealed a better agreement between fluorescence and phase contrast microscopy results (R = 0.987) than between fluorescence and centrifugation results (R = 0.883).
Agreement between the fluorescence and phase contrast methods was shown below 1 million spermatozoa/mL by the regression line closely paralleling the line of identity, but deviation from it was observed at concentrations below 10 000/mL. Values from the Neubauer chamber then reached the LLOD, leading to an overestimation of the concentration compared with the Leja chamber (Figures 3 and 4). The results from the centrifugation method were widely divergent from those of the Leja chamber at all concentrations tested and indicated consistent underestimation (Figure 4). The signed rank test revealed significantly lower median concentrations assessed by centrifugation (wet preparation: 3180/mL) than those assessed by both phase contrast microscopy (Neubauer chamber: 10 000/mL) and fluorescence microscopy (Leja chamber: 9460/mL). Mean concentrations estimated from the sperm pellet were only 49% and 53% of those generated by the Neubauer (phase contrast) and Leja (fluorescence) methods, respectively.
The mean counting errors associated with the sperm concentrations estimated by the 3 methods are presented in Figure 5. This figure shows the anticipated increase in counting error with fewer sperm counted in samples of low concentration, and that with the Neubauer chamber concentrations below 100 000/mL cannot be estimated with precision below 20%. Intercepts of the curves with the 10% and 20% error axes revealed sensitivities (spermatozoa/mL) of 500 000 and 150 000 for the Neubauer chamber, 2000 and 500 for the Leja chamber, and 300 and 60 for the sperm pellet method. For samples diluted 1:1 (as required for the fluorescence method), these limits are equivalent to 1 000 000 (300 000) spermatozoa/mL and 4000 (1000) spermatozoa/mL in undiluted semen for the 2 chambers, respectively. The lowest value for the centrifugation method does not reflect a high sensitivity; rather, it indicates that up to 70% of the spermatozoa were lost by this procedure.
The diagnosis of azoospermia is hazardous because from a statistical viewpoint it does not exist; the Poisson distribution indicates that 3.7 spermatozoa could be present in any field when none are seen. Furthermore, to achieve acceptable counting accuracy, at least 200 cells need to be counted, and such samples are clearly not azoospermic. Nevertheless, it is an important assessment to make for providing proof of success of vasectomy and for monitoring the severity of spermatogeneic inhibition by hormonal male contraception. In this study, the commonly used Neubauer improved counting chamber central square (100 μm deep, 100 nL) and a Leja large-volume chamber (100 μm deep, 25 μL) were compared with a centrifugation method for assessing low sperm concentrations in serially diluted specimens.
Although centrifugation of semen is often recommended and routinely used by an andrology laboratory, the centrifugal forces that are used differ among laboratories, and some methods are vague as to the exact requirements. This most likely leads to discrepancies among centers, though no quality control of azoospermic samples seems to have been made by external quality control programs. Furthermore, the difficulty in identifying spermatozoa within material pelleted from seminal plasma makes long scrutiny necessary. In the present study, the centrifugation method consistently underestimated the true concentrations in the sample, as judged from the methods avoiding centrifugation. This could be due to the unrepresentative sampling of the aliquot centrifuged or the inhomogeneous pellet, making visualization of spermatozoa poor without fluorescence labeling. It could also reflect the failure of the centrifugation procedure (3000 × g for 15 minutes) to pellet all the spermatozoa, as indicated by Lindsay et al (1995) and Corea et al (2005). The centrifugation procedure described here, and probably elsewhere, is inadequate for accurate determination of sperm concentration.
Although routine semen processing has been shown to be inadequate for indicating azoospermia (Jaffe et al, 1998; Corea et al, 2005), the sensitivities of the methods used have not been established. Routine semen handling according to WHO (1999) involves diluting semen, with the lowest dilution (1:25) suggested for samples with fewer than 15 spermatozoa per high-power field. The act of diluting compounds the problem of finding the occasional rare spermatozoon and may well be unnecessary when sperm numbers are so low. The lower limits of quantification (concentrations providing acceptable errors of ≤20%) determined in this study for the 2 methods were found to be about 150 000 /mL for the Neubauer chamber and 500/mL for the Leja chamber, which agree with theoretical values. For samples diluted 1:1 (as required for the fluorescence method), these limits are equivalent to 300 000 /mL and 1000/mL in undiluted semen, respectively. The sensitivity of the Neubauer method could be improved ninefold by examining the whole ruled area of the chamber (9 fields, 900 nL per chamber) and clearly was improved by use of the larger, disposable Leja chamber.
The benefit of viewing larger semen volumes (the increased chance of finding sufficient spermatozoa for acceptable counting errors) has to be offset by the longer time necessary to scan the larger microscopic areas. By introducing a fluorescent DNA dye, the appearance of spermatozoa as bright fluorescent points of light makes their recognition easier and the assessment quicker. Although other cell types also take up the stain, their nuclei are fainter and the staining is more diffuse, for the nuclei are larger (Zinaman et al, 1996). Being able to turn to phase contrast optics to confirm that a sperm tail is present is an additional benefit. Therefore, in current practice, all cells counted as sperm cells are sperm cells and no additional error is introduced by fluorescence microscopy.
In summary, centrifugation of semen samples significantly underestimates the concentration of spermatozoa in any sample considered azoospermic. The use of a Neubauer chamber, utilizing the central field of the slide, permits measurements down to 150 000 spermatozoa/mL of 1:1 diluted sample with acceptable counting errors, equivalent to 300 000/mL of undiluted semen. This sensitivity could be increased by assessing all 9 microscopic fields without loss of precision. The use of a disposable Leja 25-μL chamber provided the higher sensitivity of the chambers tested, equivalent to 1000 spermatozoa/mL of undiluted semen. It is suggested that the results of azoospermia be qualified by the sensitivity of the assay method used, as for other analytes. Thus, providing a 1:1 dilution of semen made “nondetectable” would be fewer than 300 000/mL for the Neubauer chamber (central square), fewer than 30 000/mL for the Neubauer chamber (all 9 fields), and fewer than 1000/mL for the Leja chamber.


 分享
分享
 求助内容:
求助内容: 应助结果提醒方式:
 扫码关注我们
