{"title":"Chromosome visualization tool: a whole genome viewer.","authors":"Ethalinda K S Cannon, Steven B Cannon","doi":"10.1155/2011/373875","DOIUrl":null,"url":null,"abstract":"<p><p>CViT (chromosome visualization tool) is a Perl utility for quickly generating images of features on a whole genome at once. It reads GFF3-formated data representing chromosomes (linkage groups or pseudomolecules) and sets of features on those chromosomes. It can display features on any chromosomal unit system, including genetic (centimorgan), cytological (centiMcClintock), and DNA unit (base-pair) coordinates. CViT has been used to track sequencing progress (status of genome sequencing, location and number of gaps), to visualize BLAST hits on a whole genome view, to associate maps with one another, to locate regions of repeat densities to display syntenic regions, and to visualize centromeres and knobs on chromosomes.</p>","PeriodicalId":73471,"journal":{"name":"International journal of plant genomics","volume":" ","pages":"373875"},"PeriodicalIF":0.0000,"publicationDate":"2011-01-01","publicationTypes":"Journal Article","fieldsOfStudy":null,"isOpenAccess":false,"openAccessPdf":"https://sci-hub-pdf.com/10.1155/2011/373875","citationCount":"33","resultStr":null,"platform":"Semanticscholar","paperid":null,"PeriodicalName":"International journal of plant genomics","FirstCategoryId":"1085","ListUrlMain":"https://doi.org/10.1155/2011/373875","RegionNum":0,"RegionCategory":null,"ArticlePicture":[],"TitleCN":null,"AbstractTextCN":null,"PMCID":null,"EPubDate":"2011/12/19 0:00:00","PubModel":"Epub","JCR":"","JCRName":"","Score":null,"Total":0}
引用次数: 33
Abstract
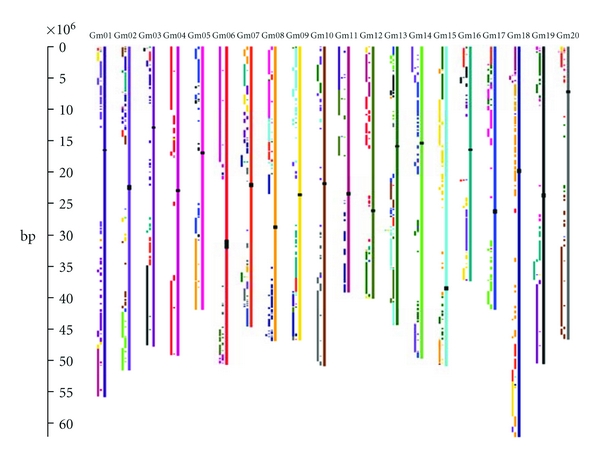
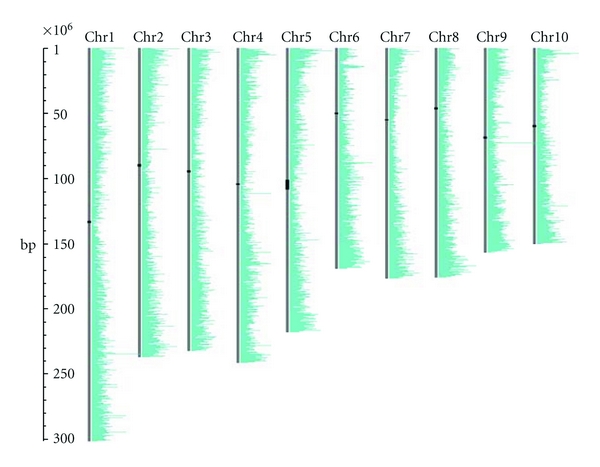
CViT (chromosome visualization tool) is a Perl utility for quickly generating images of features on a whole genome at once. It reads GFF3-formated data representing chromosomes (linkage groups or pseudomolecules) and sets of features on those chromosomes. It can display features on any chromosomal unit system, including genetic (centimorgan), cytological (centiMcClintock), and DNA unit (base-pair) coordinates. CViT has been used to track sequencing progress (status of genome sequencing, location and number of gaps), to visualize BLAST hits on a whole genome view, to associate maps with one another, to locate regions of repeat densities to display syntenic regions, and to visualize centromeres and knobs on chromosomes.


 分享
分享

 求助内容:
求助内容: 应助结果提醒方式:
 扫码关注我们
