{"title":"Issue Information","authors":"","doi":"10.1002/cptx.82","DOIUrl":null,"url":null,"abstract":"<p><b>Cover</b>: In Dikovskaya and Dinkova-Kostova et al. (http://doi.org/10.1002/cptx.96), the image shows <b>(A</b>) Data processing pipeline for an individual FLIM measurement. A fluorescence lifetime data file acquired with SPCM software that contains fluorescence decay measurements is first processed in SPCImage to determine a value of fluorescence lifetime in each pixel, using a 1-component exponential decay fitting. The data are exported from SPCImage as two files, “<span>_photons.asc</span>” containing photon numbers in pixel positions and “<span>_t1.asc</span>” containing fluorescence lifetime values in pixel positions. The “<span>_photons.asc</span>” file depicting cell morphology is imported to ImageJ/FIJI, and areas of interest, such as entire cell, cytoplasm, or nucleus, are outlined within this file. For each area of interest, a new text image file is generated in which all values outside selected areas are set to zero. These files and the “<span>_t1.asc</span>” file are further combined within the FLIM DAtaSet Tool (FLIMDAST) that assembles the data into a 3D array, and generates scatterplots of fluorescence lifetime versus photon number in corresponding non-zero pixels of the cellular image, with optional color-coding for different cellular areas. (<b>B</b>) Visualization and calculation of fluorescence lifetime changes in FLIMDAST. The data from the same repeatedly measured cell are first processed as in A, and the 3D arrays representing individual cellular measurements are assembled together and displayed as an overlay of fluorescence lifetime versus photon number scatterplots. The change in fluorescence lifetime is apparent as a vertical shift of the entire distribution. To quantify this shift, a local polynomial regression (LOESS) curve is fitted to each dataset (red and dark blue lines), and the average difference between reference and non-reference curves is determined within the range of photon numbers common to both distributions after removing the brightest 0.5% and the dimmest 0.5% of the pixels from each dataset (gray shaded area), as illustrated in the “quantification of change compared to reference” panel. This produces a single value of change in the fluorescence lifetime from the reference measurement for each non-reference measurement. (<b>C</b>) Analysis of the entire time-course experiment within FLIMDAST. The FLIM data from multiple cells for multiple experimental conditions repeatedly collected throughout the time course are located and assembled within FLIMDAST, and each measurement is assigned a reference to which it will be compared. Several measurements of the same cell can share the same reference, as depicted in the “multiple data assembly” panel. The entire experiment is processed at once, to generate overlay scatterplots similar to that in B, as shown in the “multiple data visualisation” panel. The changes in fluorescence lifetimes are also quantified at once for all measurement-reference pairs in the entire experiment, using the same algorithm as in B, and is provided as a table, as illustrated in the “multiple data quantification” panel.\n\n <figure>\n <div><picture>\n <source></source></picture><p></p>\n </div>\n </figure></p>","PeriodicalId":72743,"journal":{"name":"Current protocols in toxicology","volume":"85 1","pages":""},"PeriodicalIF":0.0000,"publicationDate":"2020-09-04","publicationTypes":"Journal Article","fieldsOfStudy":null,"isOpenAccess":false,"openAccessPdf":"https://sci-hub-pdf.com/10.1002/cptx.82","citationCount":"0","resultStr":null,"platform":"Semanticscholar","paperid":null,"PeriodicalName":"Current protocols in toxicology","FirstCategoryId":"1085","ListUrlMain":"https://onlinelibrary.wiley.com/doi/10.1002/cptx.82","RegionNum":0,"RegionCategory":null,"ArticlePicture":[],"TitleCN":null,"AbstractTextCN":null,"PMCID":null,"EPubDate":"","PubModel":"","JCR":"","JCRName":"","Score":null,"Total":0}
引用次数: 0
Abstract
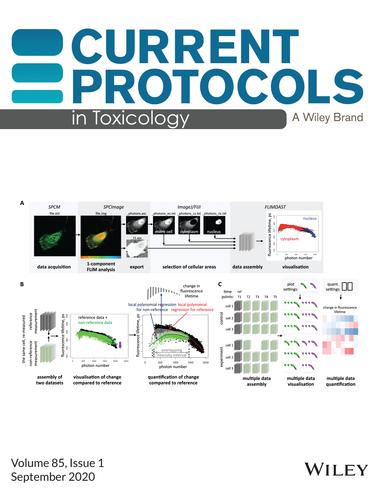
Cover: In Dikovskaya and Dinkova-Kostova et al. (http://doi.org/10.1002/cptx.96), the image shows (A) Data processing pipeline for an individual FLIM measurement. A fluorescence lifetime data file acquired with SPCM software that contains fluorescence decay measurements is first processed in SPCImage to determine a value of fluorescence lifetime in each pixel, using a 1-component exponential decay fitting. The data are exported from SPCImage as two files, “_photons.asc” containing photon numbers in pixel positions and “_t1.asc” containing fluorescence lifetime values in pixel positions. The “_photons.asc” file depicting cell morphology is imported to ImageJ/FIJI, and areas of interest, such as entire cell, cytoplasm, or nucleus, are outlined within this file. For each area of interest, a new text image file is generated in which all values outside selected areas are set to zero. These files and the “_t1.asc” file are further combined within the FLIM DAtaSet Tool (FLIMDAST) that assembles the data into a 3D array, and generates scatterplots of fluorescence lifetime versus photon number in corresponding non-zero pixels of the cellular image, with optional color-coding for different cellular areas. (B) Visualization and calculation of fluorescence lifetime changes in FLIMDAST. The data from the same repeatedly measured cell are first processed as in A, and the 3D arrays representing individual cellular measurements are assembled together and displayed as an overlay of fluorescence lifetime versus photon number scatterplots. The change in fluorescence lifetime is apparent as a vertical shift of the entire distribution. To quantify this shift, a local polynomial regression (LOESS) curve is fitted to each dataset (red and dark blue lines), and the average difference between reference and non-reference curves is determined within the range of photon numbers common to both distributions after removing the brightest 0.5% and the dimmest 0.5% of the pixels from each dataset (gray shaded area), as illustrated in the “quantification of change compared to reference” panel. This produces a single value of change in the fluorescence lifetime from the reference measurement for each non-reference measurement. (C) Analysis of the entire time-course experiment within FLIMDAST. The FLIM data from multiple cells for multiple experimental conditions repeatedly collected throughout the time course are located and assembled within FLIMDAST, and each measurement is assigned a reference to which it will be compared. Several measurements of the same cell can share the same reference, as depicted in the “multiple data assembly” panel. The entire experiment is processed at once, to generate overlay scatterplots similar to that in B, as shown in the “multiple data visualisation” panel. The changes in fluorescence lifetimes are also quantified at once for all measurement-reference pairs in the entire experiment, using the same algorithm as in B, and is provided as a table, as illustrated in the “multiple data quantification” panel.


 分享
分享

 求助内容:
求助内容: 应助结果提醒方式:
 扫码关注我们
