{"title":"Electrochemical contributions: Marcel Pourbaix (1904–1998)","authors":"Evgeny Katz","doi":"10.1002/elsa.202200015","DOIUrl":null,"url":null,"abstract":"<p>Marcel Pourbaix (Figure 1) was a Belgian chemist (born in Russia) who greatly contributed to studies on corrosion. His biggest achievement is the derivation of potential-pH diagrams, better known as “Pourbaix Diagrams” (Figure 2a). Pourbaix Diagrams are thermodynamic charts constructed using the Nernst equation. They visualize the relationship between possible redox states of a system, bounded by lines representing the reactions between them under thermodynamic equilibrium. The Pourbaix diagrams can be read much like phase diagrams. In 1963, Pourbaix produced “Atlas of Electrochemical Equilibria in Aqueous Solutions” (Figure 2b), which contains potential-pH diagrams for all elements known at the time. Pourbaix and his collaborators began preparing the work in the early 1950s and continued the diagram updates over many years.</p><p>The author declares no conflict of interest.</p>","PeriodicalId":93746,"journal":{"name":"Electrochemical science advances","volume":"3 1","pages":""},"PeriodicalIF":4.1000,"publicationDate":"2023-01-06","publicationTypes":"Journal Article","fieldsOfStudy":null,"isOpenAccess":false,"openAccessPdf":"https://onlinelibrary.wiley.com/doi/epdf/10.1002/elsa.202200015","citationCount":"0","resultStr":null,"platform":"Semanticscholar","paperid":null,"PeriodicalName":"Electrochemical science advances","FirstCategoryId":"1085","ListUrlMain":"https://onlinelibrary.wiley.com/doi/10.1002/elsa.202200015","RegionNum":0,"RegionCategory":null,"ArticlePicture":[],"TitleCN":null,"AbstractTextCN":null,"PMCID":null,"EPubDate":"","PubModel":"","JCR":"Q2","JCRName":"ELECTROCHEMISTRY","Score":null,"Total":0}
引用次数: 0
Abstract
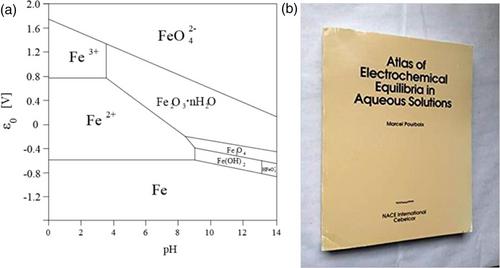
Marcel Pourbaix (Figure 1) was a Belgian chemist (born in Russia) who greatly contributed to studies on corrosion. His biggest achievement is the derivation of potential-pH diagrams, better known as “Pourbaix Diagrams” (Figure 2a). Pourbaix Diagrams are thermodynamic charts constructed using the Nernst equation. They visualize the relationship between possible redox states of a system, bounded by lines representing the reactions between them under thermodynamic equilibrium. The Pourbaix diagrams can be read much like phase diagrams. In 1963, Pourbaix produced “Atlas of Electrochemical Equilibria in Aqueous Solutions” (Figure 2b), which contains potential-pH diagrams for all elements known at the time. Pourbaix and his collaborators began preparing the work in the early 1950s and continued the diagram updates over many years.


 分享
分享

 求助内容:
求助内容: 应助结果提醒方式:
 扫码关注我们
