Candice Dry, Michelle K. Pedretti, Elizabeth Nathan, Jan E. Dickinson
{"title":"澳大利亚产科人群中四个胎儿生物测量生长图表的比较","authors":"Candice Dry, Michelle K. Pedretti, Elizabeth Nathan, Jan E. Dickinson","doi":"10.1002/ajum.12290","DOIUrl":null,"url":null,"abstract":"<div>\n \n \n <section>\n \n <h3> Purpose</h3>\n \n <p>The aim of this study was to investigate the applicability of four existing fetal growth charts to a local tertiary hospital obstetric population.</p>\n </section>\n \n <section>\n \n <h3> Method</h3>\n \n <p>Four existing fetal growth charts (the Raine study reference charts, INTERGROWTH-21st charts, World Health Organization (WHO) fetal growth study charts and Australasian Society for Ultrasound in Medicine (ASUM) endorsed Campbell Westerway charts were compared using data from 11651 singleton pregnancy ultrasound scans at King Edward Memorial Hospital (KEMH). The 3rd, 10th, 50th 90th and 97th percentile curves for abdominal circumference (AC) biometry for the KEMH data were calculated and the four primary correlation parameters from fitted 3rd order polynomials (a, b, c and d) were used to generate like-for-like comparisons for all charts.</p>\n </section>\n \n <section>\n \n <h3> Results</h3>\n \n <p>The overall comparisons showed a significant variation with different growth charts, giving different percentiles for the same fetal AC measurement. INTERGROWTH-21st percentile curves tended to fall below those of other charts for AC measurements. Both the Raine Study charts and ASUM charts were the charts of closest overall fit to the local data.</p>\n </section>\n \n <section>\n \n <h3> Conclusion</h3>\n \n <p>Our data show the Raine Study charts are the most appropriate for our population compared with the other three charts assessed suggesting the ‘one size fits all’ model may not be appropriate. However, additional analysis of biometry measurements, primarily AC, is needed to address the deficiency of data at 14-18 weeks gestation which exists for the Raine Study data.</p>\n \n <p>A reasonable alternative may be to adopt the WHO charts with local calibration (including the 14 - 18 week gestation period).</p>\n </section>\n </div>","PeriodicalId":36517,"journal":{"name":"Australasian Journal of Ultrasound in Medicine","volume":null,"pages":null},"PeriodicalIF":0.0000,"publicationDate":"2022-02-24","publicationTypes":"Journal Article","fieldsOfStudy":null,"isOpenAccess":false,"openAccessPdf":"https://www.ncbi.nlm.nih.gov/pmc/articles/PMC8873619/pdf/AJUM-25-5.pdf","citationCount":"1","resultStr":"{\"title\":\"A comparison of four fetal biometry growth charts within an Australian obstetric population\",\"authors\":\"Candice Dry, Michelle K. Pedretti, Elizabeth Nathan, Jan E. Dickinson\",\"doi\":\"10.1002/ajum.12290\",\"DOIUrl\":null,\"url\":null,\"abstract\":\"<div>\\n \\n \\n <section>\\n \\n <h3> Purpose</h3>\\n \\n <p>The aim of this study was to investigate the applicability of four existing fetal growth charts to a local tertiary hospital obstetric population.</p>\\n </section>\\n \\n <section>\\n \\n <h3> Method</h3>\\n \\n <p>Four existing fetal growth charts (the Raine study reference charts, INTERGROWTH-21st charts, World Health Organization (WHO) fetal growth study charts and Australasian Society for Ultrasound in Medicine (ASUM) endorsed Campbell Westerway charts were compared using data from 11651 singleton pregnancy ultrasound scans at King Edward Memorial Hospital (KEMH). The 3rd, 10th, 50th 90th and 97th percentile curves for abdominal circumference (AC) biometry for the KEMH data were calculated and the four primary correlation parameters from fitted 3rd order polynomials (a, b, c and d) were used to generate like-for-like comparisons for all charts.</p>\\n </section>\\n \\n <section>\\n \\n <h3> Results</h3>\\n \\n <p>The overall comparisons showed a significant variation with different growth charts, giving different percentiles for the same fetal AC measurement. INTERGROWTH-21st percentile curves tended to fall below those of other charts for AC measurements. Both the Raine Study charts and ASUM charts were the charts of closest overall fit to the local data.</p>\\n </section>\\n \\n <section>\\n \\n <h3> Conclusion</h3>\\n \\n <p>Our data show the Raine Study charts are the most appropriate for our population compared with the other three charts assessed suggesting the ‘one size fits all’ model may not be appropriate. However, additional analysis of biometry measurements, primarily AC, is needed to address the deficiency of data at 14-18 weeks gestation which exists for the Raine Study data.</p>\\n \\n <p>A reasonable alternative may be to adopt the WHO charts with local calibration (including the 14 - 18 week gestation period).</p>\\n </section>\\n </div>\",\"PeriodicalId\":36517,\"journal\":{\"name\":\"Australasian Journal of Ultrasound in Medicine\",\"volume\":null,\"pages\":null},\"PeriodicalIF\":0.0000,\"publicationDate\":\"2022-02-24\",\"publicationTypes\":\"Journal Article\",\"fieldsOfStudy\":null,\"isOpenAccess\":false,\"openAccessPdf\":\"https://www.ncbi.nlm.nih.gov/pmc/articles/PMC8873619/pdf/AJUM-25-5.pdf\",\"citationCount\":\"1\",\"resultStr\":null,\"platform\":\"Semanticscholar\",\"paperid\":null,\"PeriodicalName\":\"Australasian Journal of Ultrasound in Medicine\",\"FirstCategoryId\":\"1085\",\"ListUrlMain\":\"https://onlinelibrary.wiley.com/doi/10.1002/ajum.12290\",\"RegionNum\":0,\"RegionCategory\":null,\"ArticlePicture\":[],\"TitleCN\":null,\"AbstractTextCN\":null,\"PMCID\":null,\"EPubDate\":\"\",\"PubModel\":\"\",\"JCR\":\"Q3\",\"JCRName\":\"Medicine\",\"Score\":null,\"Total\":0}","platform":"Semanticscholar","paperid":null,"PeriodicalName":"Australasian Journal of Ultrasound in Medicine","FirstCategoryId":"1085","ListUrlMain":"https://onlinelibrary.wiley.com/doi/10.1002/ajum.12290","RegionNum":0,"RegionCategory":null,"ArticlePicture":[],"TitleCN":null,"AbstractTextCN":null,"PMCID":null,"EPubDate":"","PubModel":"","JCR":"Q3","JCRName":"Medicine","Score":null,"Total":0}
引用次数: 1
摘要
目的本研究的目的是探讨四种现有的胎儿生长图表对当地三级医院产科人口的适用性。方法采用爱德华国王纪念医院(King Edward Memorial Hospital, KEMH) 11651例单胎妊娠超声扫描数据,比较现有的四种胎儿生长图(Raine研究参考图、intergrowth -21图、世界卫生组织(WHO)胎儿生长研究图和澳大利亚超声医学学会(ASUM)认可的Campbell Westerway图)。计算KEMH数据的腹围(AC)生物计量学的第3、第10、第50、第90和第97百分位曲线,并使用拟合三阶多项式(a、b、c和d)的四个主要相关参数对所有图表进行相似比较。结果在不同的生长图上,总体比较差异显著,相同的胎儿AC测量值有不同的百分位数。intergrowth -21百分位曲线趋向于低于AC测量的其他图表。雷恩研究图和ASUM图都是最接近当地数据的总体拟合图。结论:我们的数据显示,雷恩研究图表最适合我们的人群,而其他三个评估图表表明,“一刀切”模型可能不合适。然而,需要对生物计量测量进行额外的分析,主要是AC,以解决雷恩研究数据中存在的14-18周妊娠数据的不足。一个合理的替代方案可能是采用当地校准的世卫组织图表(包括14 - 18周妊娠期)。
A comparison of four fetal biometry growth charts within an Australian obstetric population
Purpose
The aim of this study was to investigate the applicability of four existing fetal growth charts to a local tertiary hospital obstetric population.
Method
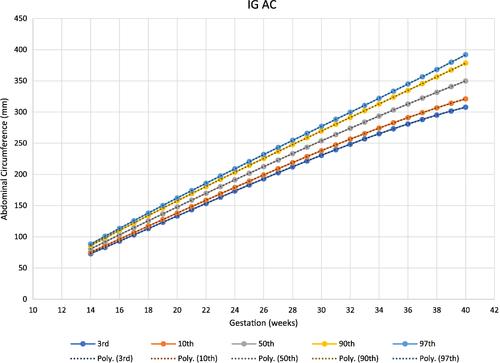
Four existing fetal growth charts (the Raine study reference charts, INTERGROWTH-21st charts, World Health Organization (WHO) fetal growth study charts and Australasian Society for Ultrasound in Medicine (ASUM) endorsed Campbell Westerway charts were compared using data from 11651 singleton pregnancy ultrasound scans at King Edward Memorial Hospital (KEMH). The 3rd, 10th, 50th 90th and 97th percentile curves for abdominal circumference (AC) biometry for the KEMH data were calculated and the four primary correlation parameters from fitted 3rd order polynomials (a, b, c and d) were used to generate like-for-like comparisons for all charts.
Results
The overall comparisons showed a significant variation with different growth charts, giving different percentiles for the same fetal AC measurement. INTERGROWTH-21st percentile curves tended to fall below those of other charts for AC measurements. Both the Raine Study charts and ASUM charts were the charts of closest overall fit to the local data.
Conclusion
Our data show the Raine Study charts are the most appropriate for our population compared with the other three charts assessed suggesting the ‘one size fits all’ model may not be appropriate. However, additional analysis of biometry measurements, primarily AC, is needed to address the deficiency of data at 14-18 weeks gestation which exists for the Raine Study data.
A reasonable alternative may be to adopt the WHO charts with local calibration (including the 14 - 18 week gestation period).


 分享
分享
 求助内容:
求助内容: 应助结果提醒方式:
 扫码关注我们
