{"title":"Transomics2cytoscape:可解释的跨组学网络 2.5 维可视化自动软件","authors":"Kozo Nishida, Junichi Maruyama, Kazunari Kaizu, Koichi Takahashi, Katsuyuki Yugi","doi":"10.1038/s41540-024-00342-8","DOIUrl":null,"url":null,"abstract":"<p>Biochemical network visualization is one of the essential technologies for mechanistic interpretation of omics data. In particular, recent advances in multi-omics measurement and analysis require the development of visualization methods that encompass multiple omics data. Visualization in 2.5 dimension (2.5D visualization), which is an isometric view of stacked X-Y planes, is a convenient way to interpret multi-omics/trans-omics data in the context of the conventional layouts of biochemical networks drawn on each of the stacked omics layers. However, 2.5D visualization of trans-omics networks is a state-of-the-art method that primarily relies on time-consuming human efforts involving manual drawing. Here, we present an R Bioconductor package ‘transomics2cytoscape’ for automated visualization of 2.5D trans-omics networks. We confirmed that transomics2cytoscape could be used for rapid visualization of trans-omics networks presented in published papers within a few minutes. Transomics2cytoscape allows for frequent update/redrawing of trans-omics networks in line with the progress in multi-omics/trans-omics data analysis, thereby enabling network-based interpretation of multi-omics data at each research step. The transomics2cytoscape source code is available at https://github.com/ecell/transomics2cytoscape.</p>","PeriodicalId":19345,"journal":{"name":"NPJ Systems Biology and Applications","volume":"1 1","pages":""},"PeriodicalIF":3.5000,"publicationDate":"2024-02-19","publicationTypes":"Journal Article","fieldsOfStudy":null,"isOpenAccess":false,"openAccessPdf":"","citationCount":"0","resultStr":"{\"title\":\"Transomics2cytoscape: an automated software for interpretable 2.5-dimensional visualization of trans-omic networks\",\"authors\":\"Kozo Nishida, Junichi Maruyama, Kazunari Kaizu, Koichi Takahashi, Katsuyuki Yugi\",\"doi\":\"10.1038/s41540-024-00342-8\",\"DOIUrl\":null,\"url\":null,\"abstract\":\"<p>Biochemical network visualization is one of the essential technologies for mechanistic interpretation of omics data. In particular, recent advances in multi-omics measurement and analysis require the development of visualization methods that encompass multiple omics data. Visualization in 2.5 dimension (2.5D visualization), which is an isometric view of stacked X-Y planes, is a convenient way to interpret multi-omics/trans-omics data in the context of the conventional layouts of biochemical networks drawn on each of the stacked omics layers. However, 2.5D visualization of trans-omics networks is a state-of-the-art method that primarily relies on time-consuming human efforts involving manual drawing. Here, we present an R Bioconductor package ‘transomics2cytoscape’ for automated visualization of 2.5D trans-omics networks. We confirmed that transomics2cytoscape could be used for rapid visualization of trans-omics networks presented in published papers within a few minutes. Transomics2cytoscape allows for frequent update/redrawing of trans-omics networks in line with the progress in multi-omics/trans-omics data analysis, thereby enabling network-based interpretation of multi-omics data at each research step. The transomics2cytoscape source code is available at https://github.com/ecell/transomics2cytoscape.</p>\",\"PeriodicalId\":19345,\"journal\":{\"name\":\"NPJ Systems Biology and Applications\",\"volume\":\"1 1\",\"pages\":\"\"},\"PeriodicalIF\":3.5000,\"publicationDate\":\"2024-02-19\",\"publicationTypes\":\"Journal Article\",\"fieldsOfStudy\":null,\"isOpenAccess\":false,\"openAccessPdf\":\"\",\"citationCount\":\"0\",\"resultStr\":null,\"platform\":\"Semanticscholar\",\"paperid\":null,\"PeriodicalName\":\"NPJ Systems Biology and Applications\",\"FirstCategoryId\":\"99\",\"ListUrlMain\":\"https://doi.org/10.1038/s41540-024-00342-8\",\"RegionNum\":2,\"RegionCategory\":\"生物学\",\"ArticlePicture\":[],\"TitleCN\":null,\"AbstractTextCN\":null,\"PMCID\":null,\"EPubDate\":\"\",\"PubModel\":\"\",\"JCR\":\"Q1\",\"JCRName\":\"MATHEMATICAL & COMPUTATIONAL BIOLOGY\",\"Score\":null,\"Total\":0}","platform":"Semanticscholar","paperid":null,"PeriodicalName":"NPJ Systems Biology and Applications","FirstCategoryId":"99","ListUrlMain":"https://doi.org/10.1038/s41540-024-00342-8","RegionNum":2,"RegionCategory":"生物学","ArticlePicture":[],"TitleCN":null,"AbstractTextCN":null,"PMCID":null,"EPubDate":"","PubModel":"","JCR":"Q1","JCRName":"MATHEMATICAL & COMPUTATIONAL BIOLOGY","Score":null,"Total":0}
Transomics2cytoscape: an automated software for interpretable 2.5-dimensional visualization of trans-omic networks
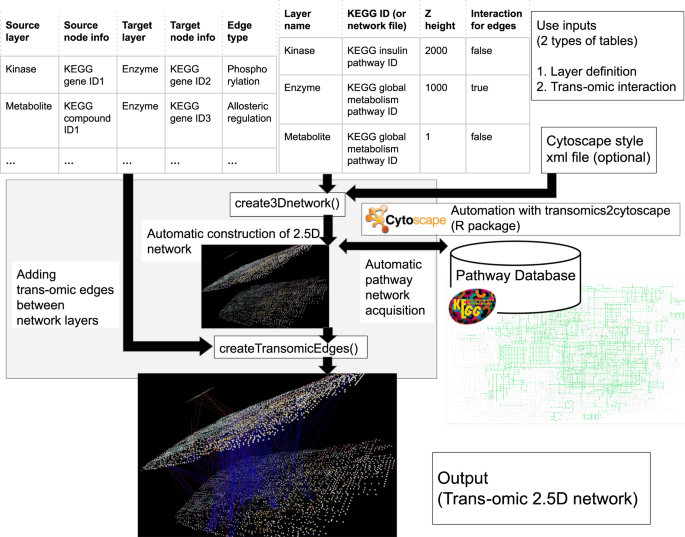
Biochemical network visualization is one of the essential technologies for mechanistic interpretation of omics data. In particular, recent advances in multi-omics measurement and analysis require the development of visualization methods that encompass multiple omics data. Visualization in 2.5 dimension (2.5D visualization), which is an isometric view of stacked X-Y planes, is a convenient way to interpret multi-omics/trans-omics data in the context of the conventional layouts of biochemical networks drawn on each of the stacked omics layers. However, 2.5D visualization of trans-omics networks is a state-of-the-art method that primarily relies on time-consuming human efforts involving manual drawing. Here, we present an R Bioconductor package ‘transomics2cytoscape’ for automated visualization of 2.5D trans-omics networks. We confirmed that transomics2cytoscape could be used for rapid visualization of trans-omics networks presented in published papers within a few minutes. Transomics2cytoscape allows for frequent update/redrawing of trans-omics networks in line with the progress in multi-omics/trans-omics data analysis, thereby enabling network-based interpretation of multi-omics data at each research step. The transomics2cytoscape source code is available at https://github.com/ecell/transomics2cytoscape.
期刊介绍:
npj Systems Biology and Applications is an online Open Access journal dedicated to publishing the premier research that takes a systems-oriented approach. The journal aims to provide a forum for the presentation of articles that help define this nascent field, as well as those that apply the advances to wider fields. We encourage studies that integrate, or aid the integration of, data, analyses and insight from molecules to organisms and broader systems. Important areas of interest include not only fundamental biological systems and drug discovery, but also applications to health, medical practice and implementation, big data, biotechnology, food science, human behaviour, broader biological systems and industrial applications of systems biology.
We encourage all approaches, including network biology, application of control theory to biological systems, computational modelling and analysis, comprehensive and/or high-content measurements, theoretical, analytical and computational studies of system-level properties of biological systems and computational/software/data platforms enabling such studies.


 分享
分享
 求助内容:
求助内容: 应助结果提醒方式:
 扫码关注我们
