{"title":"地铁轨道交通小时能耗特征:列车牵引与车站运行","authors":"Bowen Guan , Xiaohua Liu , Tao Zhang , Xinke Wang","doi":"10.1016/j.enbenv.2022.05.001","DOIUrl":null,"url":null,"abstract":"<div><p>The electricity consumption of the urban metro system can be mainly divided into the following two categories: the electricity consumption for train traction (<em>E</em><sub>t</sub>) and the electricity consumption for station operation (<em>E</em><sub>s</sub>). Although understanding the hourly fluctuation characteristics of <em>E</em><sub>t</sub> and <em>E</em><sub>s</sub> contributes to renewable energy integration and achieving carbon emission reduction of the metro system, the hourly fluctuation characteristics have been poorly reported in the literature. Thus, a typical underground non-transfer metro station of a city's metro system in the North China Plain is selected in this study, and <em>E</em><sub>t</sub> and <em>E</em><sub>s</sub> were monitored to portray their hourly fluctuation characteristics. Results reveal that the hourly <em>E</em><sub>t</sub> shows a significant intraday “U” shape on weekdays, indicating two symmetric peaks in morning and evening rush hours. While the hourly <em>E</em><sub>s</sub> shows an intraday “flat” shape, indicating it is nearly free from the effect of rush hour. Moreover, it is statistically proved that the train frequency is the core influencing factor resulting in the intraday fluctuation of hourly <em>E</em><sub>t</sub>. In the case study, when the train frequency increases from the mean (20 trains per hour) to maximum (32 trains per hour), the hourly <em>E</em><sub>t</sub> will increase by 53.4%.</p></div>","PeriodicalId":33659,"journal":{"name":"Energy and Built Environment","volume":"4 5","pages":"Pages 568-575"},"PeriodicalIF":0.0000,"publicationDate":"2023-10-01","publicationTypes":"Journal Article","fieldsOfStudy":null,"isOpenAccess":false,"openAccessPdf":"","citationCount":"3","resultStr":"{\"title\":\"Hourly energy consumption characteristics of metro rail transit: Train traction versus station operation\",\"authors\":\"Bowen Guan , Xiaohua Liu , Tao Zhang , Xinke Wang\",\"doi\":\"10.1016/j.enbenv.2022.05.001\",\"DOIUrl\":null,\"url\":null,\"abstract\":\"<div><p>The electricity consumption of the urban metro system can be mainly divided into the following two categories: the electricity consumption for train traction (<em>E</em><sub>t</sub>) and the electricity consumption for station operation (<em>E</em><sub>s</sub>). Although understanding the hourly fluctuation characteristics of <em>E</em><sub>t</sub> and <em>E</em><sub>s</sub> contributes to renewable energy integration and achieving carbon emission reduction of the metro system, the hourly fluctuation characteristics have been poorly reported in the literature. Thus, a typical underground non-transfer metro station of a city's metro system in the North China Plain is selected in this study, and <em>E</em><sub>t</sub> and <em>E</em><sub>s</sub> were monitored to portray their hourly fluctuation characteristics. Results reveal that the hourly <em>E</em><sub>t</sub> shows a significant intraday “U” shape on weekdays, indicating two symmetric peaks in morning and evening rush hours. While the hourly <em>E</em><sub>s</sub> shows an intraday “flat” shape, indicating it is nearly free from the effect of rush hour. Moreover, it is statistically proved that the train frequency is the core influencing factor resulting in the intraday fluctuation of hourly <em>E</em><sub>t</sub>. In the case study, when the train frequency increases from the mean (20 trains per hour) to maximum (32 trains per hour), the hourly <em>E</em><sub>t</sub> will increase by 53.4%.</p></div>\",\"PeriodicalId\":33659,\"journal\":{\"name\":\"Energy and Built Environment\",\"volume\":\"4 5\",\"pages\":\"Pages 568-575\"},\"PeriodicalIF\":0.0000,\"publicationDate\":\"2023-10-01\",\"publicationTypes\":\"Journal Article\",\"fieldsOfStudy\":null,\"isOpenAccess\":false,\"openAccessPdf\":\"\",\"citationCount\":\"3\",\"resultStr\":null,\"platform\":\"Semanticscholar\",\"paperid\":null,\"PeriodicalName\":\"Energy and Built Environment\",\"FirstCategoryId\":\"1085\",\"ListUrlMain\":\"https://www.sciencedirect.com/science/article/pii/S2666123322000332\",\"RegionNum\":0,\"RegionCategory\":null,\"ArticlePicture\":[],\"TitleCN\":null,\"AbstractTextCN\":null,\"PMCID\":null,\"EPubDate\":\"2022/5/4 0:00:00\",\"PubModel\":\"Epub\",\"JCR\":\"Q1\",\"JCRName\":\"Engineering\",\"Score\":null,\"Total\":0}","platform":"Semanticscholar","paperid":null,"PeriodicalName":"Energy and Built Environment","FirstCategoryId":"1085","ListUrlMain":"https://www.sciencedirect.com/science/article/pii/S2666123322000332","RegionNum":0,"RegionCategory":null,"ArticlePicture":[],"TitleCN":null,"AbstractTextCN":null,"PMCID":null,"EPubDate":"2022/5/4 0:00:00","PubModel":"Epub","JCR":"Q1","JCRName":"Engineering","Score":null,"Total":0}
Hourly energy consumption characteristics of metro rail transit: Train traction versus station operation
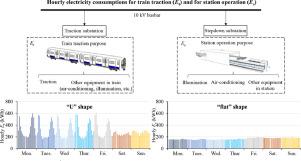
The electricity consumption of the urban metro system can be mainly divided into the following two categories: the electricity consumption for train traction (Et) and the electricity consumption for station operation (Es). Although understanding the hourly fluctuation characteristics of Et and Es contributes to renewable energy integration and achieving carbon emission reduction of the metro system, the hourly fluctuation characteristics have been poorly reported in the literature. Thus, a typical underground non-transfer metro station of a city's metro system in the North China Plain is selected in this study, and Et and Es were monitored to portray their hourly fluctuation characteristics. Results reveal that the hourly Et shows a significant intraday “U” shape on weekdays, indicating two symmetric peaks in morning and evening rush hours. While the hourly Es shows an intraday “flat” shape, indicating it is nearly free from the effect of rush hour. Moreover, it is statistically proved that the train frequency is the core influencing factor resulting in the intraday fluctuation of hourly Et. In the case study, when the train frequency increases from the mean (20 trains per hour) to maximum (32 trains per hour), the hourly Et will increase by 53.4%.


 分享
分享
 求助内容:
求助内容: 应助结果提醒方式:
 扫码关注我们
