Stephan van der Westhuizen , Gerard B.M. Heuvelink , Sugnet Gardner-Lubbe , Catherine E. Clarke
{"title":"Biplots for understanding machine learning predictions in digital soil mapping","authors":"Stephan van der Westhuizen , Gerard B.M. Heuvelink , Sugnet Gardner-Lubbe , Catherine E. Clarke","doi":"10.1016/j.ecoinf.2024.102892","DOIUrl":null,"url":null,"abstract":"<div><div>In digital soil mapping, machine learning is gradually replacing traditional statistical models because of their greater flexibility and better prediction performance. However, unlike traditional models, a notable drawback of machine learning models is that they are “black-box” in nature due to their limited ability to provide comprehensive interpretations for their predictions. Explainable machine learning (XML) methods provide visualisations that can be used to aid in understanding predictions made by machine learning models. Popular model-agnostic visualisation methods include partial dependence plots, independent conditional expectation curves, and partial dependence plots produced with Shapley values. These methods require that covariates are uncorrelated which could be restrictive. For cases where covariates are correlated, an alternative approach is the Accumulated Local Effect plot, which however is limited to depicting one or two covariates at a time. Another disadvantage of the above mentioned methods is that no readily available goodness-of-fit metric is available. In this paper we propose the use of a principal component analysis biplot as a model-agnostic method to gain insight into machine learning predictions in digital soil mapping. A biplot is a powerful visualisation tool that is used to seek patterns in multivariate data. A biplot does not require covariates included in the visualisation to be uncorrelated, and furthermore, an analytically derived goodness-of-fit metric is provided which allows the user to evaluate the accuracy of the approximation. We present examples from a case study in South Africa in which soil organic carbon is mapped with a random forest model. Our findings show that biplots can provide meaningful interpretations for predictions, making it a worthy addition to the XML toolkit.</div></div>","PeriodicalId":51024,"journal":{"name":"Ecological Informatics","volume":"84 ","pages":"Article 102892"},"PeriodicalIF":7.3000,"publicationDate":"2024-12-01","publicationTypes":"Journal Article","fieldsOfStudy":null,"isOpenAccess":false,"openAccessPdf":"","citationCount":"0","resultStr":null,"platform":"Semanticscholar","paperid":null,"PeriodicalName":"Ecological Informatics","FirstCategoryId":"93","ListUrlMain":"https://www.sciencedirect.com/science/article/pii/S1574954124004345","RegionNum":2,"RegionCategory":"环境科学与生态学","ArticlePicture":[],"TitleCN":null,"AbstractTextCN":null,"PMCID":null,"EPubDate":"2024/11/26 0:00:00","PubModel":"Epub","JCR":"Q1","JCRName":"ECOLOGY","Score":null,"Total":0}
引用次数: 0
Abstract
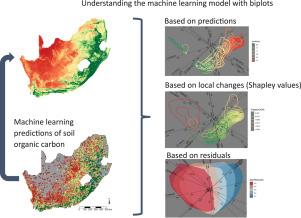
In digital soil mapping, machine learning is gradually replacing traditional statistical models because of their greater flexibility and better prediction performance. However, unlike traditional models, a notable drawback of machine learning models is that they are “black-box” in nature due to their limited ability to provide comprehensive interpretations for their predictions. Explainable machine learning (XML) methods provide visualisations that can be used to aid in understanding predictions made by machine learning models. Popular model-agnostic visualisation methods include partial dependence plots, independent conditional expectation curves, and partial dependence plots produced with Shapley values. These methods require that covariates are uncorrelated which could be restrictive. For cases where covariates are correlated, an alternative approach is the Accumulated Local Effect plot, which however is limited to depicting one or two covariates at a time. Another disadvantage of the above mentioned methods is that no readily available goodness-of-fit metric is available. In this paper we propose the use of a principal component analysis biplot as a model-agnostic method to gain insight into machine learning predictions in digital soil mapping. A biplot is a powerful visualisation tool that is used to seek patterns in multivariate data. A biplot does not require covariates included in the visualisation to be uncorrelated, and furthermore, an analytically derived goodness-of-fit metric is provided which allows the user to evaluate the accuracy of the approximation. We present examples from a case study in South Africa in which soil organic carbon is mapped with a random forest model. Our findings show that biplots can provide meaningful interpretations for predictions, making it a worthy addition to the XML toolkit.
期刊介绍:
The journal Ecological Informatics is devoted to the publication of high quality, peer-reviewed articles on all aspects of computational ecology, data science and biogeography. The scope of the journal takes into account the data-intensive nature of ecology, the growing capacity of information technology to access, harness and leverage complex data as well as the critical need for informing sustainable management in view of global environmental and climate change.
The nature of the journal is interdisciplinary at the crossover between ecology and informatics. It focuses on novel concepts and techniques for image- and genome-based monitoring and interpretation, sensor- and multimedia-based data acquisition, internet-based data archiving and sharing, data assimilation, modelling and prediction of ecological data.


 分享
分享
 求助内容:
求助内容: 应助结果提醒方式:
 扫码关注我们
