Comparison of 2D and 3D radiomics features with conventional features based on contrast-enhanced CT images for preoperative prediction the risk of thymic epithelial tumors.
Yu-Hang Yuan, Hui Zhang, Wei-Ling Xu, Dong Dong, Pei-Hong Gao, Cai-Juan Zhang, Yan Guo, Ling-Ling Tong, Fang-Chao Gong
{"title":"Comparison of 2D and 3D radiomics features with conventional features based on contrast-enhanced CT images for preoperative prediction the risk of thymic epithelial tumors.","authors":"Yu-Hang Yuan, Hui Zhang, Wei-Ling Xu, Dong Dong, Pei-Hong Gao, Cai-Juan Zhang, Yan Guo, Ling-Ling Tong, Fang-Chao Gong","doi":"10.2478/raon-2025-0016","DOIUrl":null,"url":null,"abstract":"<p><strong>Background: </strong>This study aimed to develop and validate 2-Dimensional (2D) and 3-Dimensional (3D) radiomics signatures based on contrast-enhanced computed tomography (CECT) images for preoperative prediction of the thymic epithelial tumors (TETs) risk and compare the predictive performance with conventional CT features.</p><p><strong>Patients and methods: </strong>149 TET patients were retrospectively enrolled from January 2016 to December 2018, and divided into high-risk group (B2/B3/TCs, n = 103) and low-risk group (A/AB/B1, n = 46). All patients were randomly assigned into the training (n = 104) and testing (n = 45) set. 14 conventional CT features were collected, and 396 radiomic features were extracted from 2D and 3D CECT images, respectively. Three models including conventional, 2D radiomics and 3D radiomics model were established using multivariate logistic regression analysis. The discriminative performances of the models were demonstrated by receiver operating characteristic (ROC) curves.</p><p><strong>Results: </strong>In the conventional model, area under the curves (AUCs) in the training and validation sets were 0.863 and 0.853, sensitivity was 78% and 55%, and specificity was 88% and 100%, respectively. The 2D model yielded AUCs of 0.854 and 0.834, sensitivity of 86% and 77%, and specificity of 72% and 86% in the training and validation sets. The 3D model revealed AUC of 0.902 and 0.906, sensitivity of 75% and 68%, and specificity of 94% and 100% in the training and validation sets.</p><p><strong>Conclusions: </strong>Radiomics signatures based on 3D images could distinguish high-risk from low-risk TETs and provide complementary diagnostic information.</p>","PeriodicalId":21034,"journal":{"name":"Radiology and Oncology","volume":"59 1","pages":"69-78"},"PeriodicalIF":2.2000,"publicationDate":"2025-02-27","publicationTypes":"Journal Article","fieldsOfStudy":null,"isOpenAccess":false,"openAccessPdf":"https://www.ncbi.nlm.nih.gov/pmc/articles/PMC11867572/pdf/","citationCount":"0","resultStr":null,"platform":"Semanticscholar","paperid":null,"PeriodicalName":"Radiology and Oncology","FirstCategoryId":"3","ListUrlMain":"https://doi.org/10.2478/raon-2025-0016","RegionNum":4,"RegionCategory":"医学","ArticlePicture":[],"TitleCN":null,"AbstractTextCN":null,"PMCID":null,"EPubDate":"2025/3/1 0:00:00","PubModel":"eCollection","JCR":"Q3","JCRName":"ONCOLOGY","Score":null,"Total":0}
引用次数: 0
Abstract
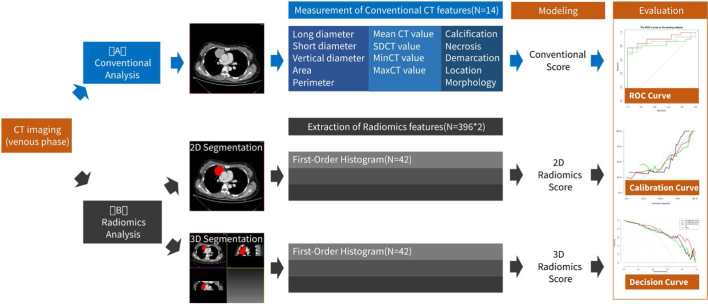
Background: This study aimed to develop and validate 2-Dimensional (2D) and 3-Dimensional (3D) radiomics signatures based on contrast-enhanced computed tomography (CECT) images for preoperative prediction of the thymic epithelial tumors (TETs) risk and compare the predictive performance with conventional CT features.
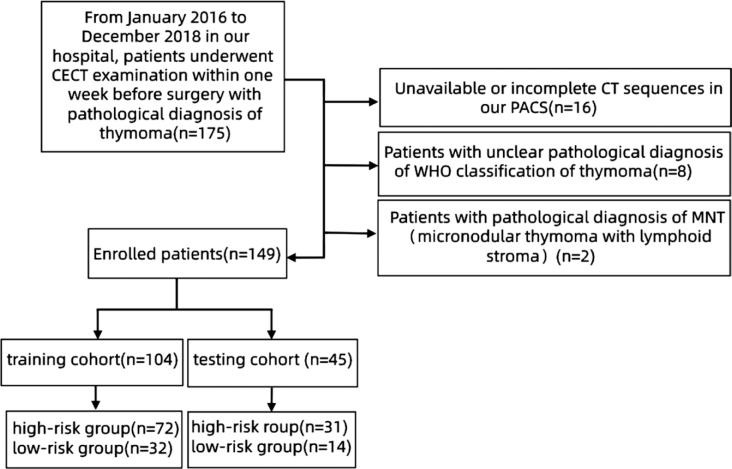
Patients and methods: 149 TET patients were retrospectively enrolled from January 2016 to December 2018, and divided into high-risk group (B2/B3/TCs, n = 103) and low-risk group (A/AB/B1, n = 46). All patients were randomly assigned into the training (n = 104) and testing (n = 45) set. 14 conventional CT features were collected, and 396 radiomic features were extracted from 2D and 3D CECT images, respectively. Three models including conventional, 2D radiomics and 3D radiomics model were established using multivariate logistic regression analysis. The discriminative performances of the models were demonstrated by receiver operating characteristic (ROC) curves.
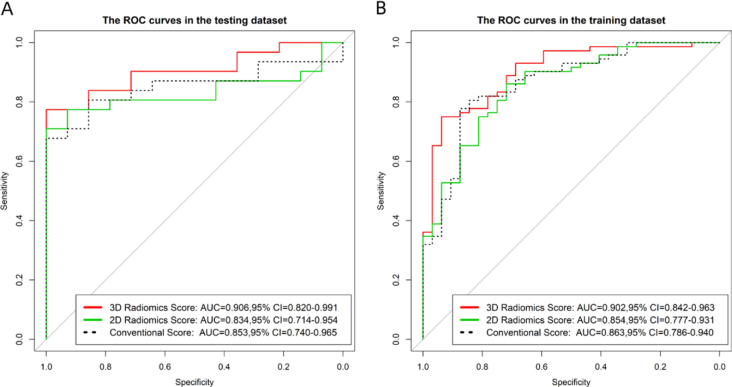
Results: In the conventional model, area under the curves (AUCs) in the training and validation sets were 0.863 and 0.853, sensitivity was 78% and 55%, and specificity was 88% and 100%, respectively. The 2D model yielded AUCs of 0.854 and 0.834, sensitivity of 86% and 77%, and specificity of 72% and 86% in the training and validation sets. The 3D model revealed AUC of 0.902 and 0.906, sensitivity of 75% and 68%, and specificity of 94% and 100% in the training and validation sets.
Conclusions: Radiomics signatures based on 3D images could distinguish high-risk from low-risk TETs and provide complementary diagnostic information.
期刊介绍:
Radiology and Oncology is a multidisciplinary journal devoted to the publishing original and high quality scientific papers and review articles, pertinent to diagnostic and interventional radiology, computerized tomography, magnetic resonance, ultrasound, nuclear medicine, radiotherapy, clinical and experimental oncology, radiobiology, medical physics and radiation protection. Therefore, the scope of the journal is to cover beside radiology the diagnostic and therapeutic aspects in oncology, which distinguishes it from other journals in the field.


 分享
分享
 求助内容:
求助内容: 应助结果提醒方式:
 扫码关注我们
