{"title":"对 \"生活史介导人口复原力不同组成部分之间的权衡 \"的更正。","authors":"","doi":"10.1111/ele.14468","DOIUrl":null,"url":null,"abstract":"<p>Capdevila P, Stott I, Cant J, Beger M, Rowlands G, Grace M, Salguero-Gómez R. (2022) Life history mediates the trade-offs among different components of demographic resilience. <i>Ecology Letters</i>, 25(6), 1566–1579. https://doi.org/10.1111/ele.14004</p><p>The authors note a mistake in the calculation of resistance in the methods section, which alters the interpretation of some of the results. In the manuscript, we applied a correction to calculation of resistance (<span></span><math>\n <semantics>\n <mrow>\n <msub>\n <munder>\n <mi>ρ</mi>\n <mo>_</mo>\n </munder>\n <mn>1</mn>\n </msub>\n </mrow>\n <annotation>$$ {\\underset{\\_}{\\rho}}_1 $$</annotation>\n </semantics></math>) in Equation (3) by subtracting the first step attenuation from 1 (1 − <span></span><math>\n <semantics>\n <mrow>\n <msub>\n <munder>\n <mi>ρ</mi>\n <mo>_</mo>\n </munder>\n <mn>1</mn>\n </msub>\n </mrow>\n <annotation>$$ {\\underset{\\_}{\\rho}}_1 $$</annotation>\n </semantics></math>). Such subtraction in the formula was an error, and the correct calculation should simply be <span></span><math>\n <semantics>\n <mrow>\n <msub>\n <munder>\n <mi>ρ</mi>\n <mo>_</mo>\n </munder>\n <mn>1</mn>\n </msub>\n </mrow>\n <annotation>$$ {\\underset{\\_}{\\rho}}_1 $$</annotation>\n </semantics></math> where values close to 1 correspond to high resistance and 0 to low resistance.</p><p>In Figure 2 of the original manuscript, we showed that the phylogenetic signal for resistance was 0.48 ± 0.26 (mean ± SE) in animals and 0.02 ± 0.04 in plants. When applying the correct calculation of resistance the phylogenetic signal remains virtually unaltered, with values of 0.45 ± 0.25 and 0.03 ± 0.04, respectively.</p><p>In Figure 3 of the original manuscript, we showed that resistance and recovery time were positively associated in animals and slightly, negatively associated in plants. Also, resistance and compensation were positively associated in animals and plants. When applying the correct calculation of resistance, the same associations hold, but the correlation values are inverted. That is, resistance and recovery time are negatively correlated in animals (Figure 3a) and positively correlated in plants (Figure 3d), while resistance and compensation are negatively correlated for both animals (Figure 3d) and plants (Figure 3e).</p><p>In Figure 4 of the original version of our paper, we showed that resistance was negatively associated with generation time in animals, while it was positively associated in plants. We also showed that resistance was positively associated with reproductive output for both plants and animals. When applying the correct calculation of resistance, we again show that the associations hold, but naturally they are reversed (Figure 4). Resistance is positively associated with generation time in animals and negatively associated in plants (Figure 4b), and resistance is negatively associated with reproductive output in both plants and animals (Figure 4e).</p><p>In the original supplementary analyses, we showed that most of the correlations among the life history traits and the resilience components were not spurious. When applying the correct calculation of resistance, there are still discrepancies between the simulated and the natural populations in their association of resistance with life history traits. The only difference is that the relationships with resistance are inverted (Figure S1).</p><p>In the original supplementary analyses, we showed resistance was independent of body dimension for both animals and plants, with the slopes of these correlations showing no clear trend. This pattern holds for the updated version of the plot but with the resistance axis reversed (Figure S2b,e).</p><p>In Figure S3 of the original supplementary materials, we showed that resistance did not have any clear association with the Raunkiær life forms. The updated version shows the same patterns, but with the resistance axes reversed (Figure S3, middle panel).</p><p>In Figure S4 of the original supplementary materials, we showed that there was a high variation in the compensation, resistance and recovery time among the different conservation statuses of the species (Figure S4). These results remain unaltered, but the resistance axes are reversed (Figure S4, middle panels).</p>","PeriodicalId":161,"journal":{"name":"Ecology Letters","volume":"27 7","pages":""},"PeriodicalIF":7.7000,"publicationDate":"2024-07-22","publicationTypes":"Journal Article","fieldsOfStudy":null,"isOpenAccess":false,"openAccessPdf":"https://onlinelibrary.wiley.com/doi/epdf/10.1111/ele.14468","citationCount":"0","resultStr":"{\"title\":\"Correction to ‘Life history mediates the trade-offs among different components of demographic resilience’\",\"authors\":\"\",\"doi\":\"10.1111/ele.14468\",\"DOIUrl\":null,\"url\":null,\"abstract\":\"<p>Capdevila P, Stott I, Cant J, Beger M, Rowlands G, Grace M, Salguero-Gómez R. (2022) Life history mediates the trade-offs among different components of demographic resilience. <i>Ecology Letters</i>, 25(6), 1566–1579. https://doi.org/10.1111/ele.14004</p><p>The authors note a mistake in the calculation of resistance in the methods section, which alters the interpretation of some of the results. In the manuscript, we applied a correction to calculation of resistance (<span></span><math>\\n <semantics>\\n <mrow>\\n <msub>\\n <munder>\\n <mi>ρ</mi>\\n <mo>_</mo>\\n </munder>\\n <mn>1</mn>\\n </msub>\\n </mrow>\\n <annotation>$$ {\\\\underset{\\\\_}{\\\\rho}}_1 $$</annotation>\\n </semantics></math>) in Equation (3) by subtracting the first step attenuation from 1 (1 − <span></span><math>\\n <semantics>\\n <mrow>\\n <msub>\\n <munder>\\n <mi>ρ</mi>\\n <mo>_</mo>\\n </munder>\\n <mn>1</mn>\\n </msub>\\n </mrow>\\n <annotation>$$ {\\\\underset{\\\\_}{\\\\rho}}_1 $$</annotation>\\n </semantics></math>). Such subtraction in the formula was an error, and the correct calculation should simply be <span></span><math>\\n <semantics>\\n <mrow>\\n <msub>\\n <munder>\\n <mi>ρ</mi>\\n <mo>_</mo>\\n </munder>\\n <mn>1</mn>\\n </msub>\\n </mrow>\\n <annotation>$$ {\\\\underset{\\\\_}{\\\\rho}}_1 $$</annotation>\\n </semantics></math> where values close to 1 correspond to high resistance and 0 to low resistance.</p><p>In Figure 2 of the original manuscript, we showed that the phylogenetic signal for resistance was 0.48 ± 0.26 (mean ± SE) in animals and 0.02 ± 0.04 in plants. When applying the correct calculation of resistance the phylogenetic signal remains virtually unaltered, with values of 0.45 ± 0.25 and 0.03 ± 0.04, respectively.</p><p>In Figure 3 of the original manuscript, we showed that resistance and recovery time were positively associated in animals and slightly, negatively associated in plants. Also, resistance and compensation were positively associated in animals and plants. When applying the correct calculation of resistance, the same associations hold, but the correlation values are inverted. That is, resistance and recovery time are negatively correlated in animals (Figure 3a) and positively correlated in plants (Figure 3d), while resistance and compensation are negatively correlated for both animals (Figure 3d) and plants (Figure 3e).</p><p>In Figure 4 of the original version of our paper, we showed that resistance was negatively associated with generation time in animals, while it was positively associated in plants. We also showed that resistance was positively associated with reproductive output for both plants and animals. When applying the correct calculation of resistance, we again show that the associations hold, but naturally they are reversed (Figure 4). Resistance is positively associated with generation time in animals and negatively associated in plants (Figure 4b), and resistance is negatively associated with reproductive output in both plants and animals (Figure 4e).</p><p>In the original supplementary analyses, we showed that most of the correlations among the life history traits and the resilience components were not spurious. When applying the correct calculation of resistance, there are still discrepancies between the simulated and the natural populations in their association of resistance with life history traits. The only difference is that the relationships with resistance are inverted (Figure S1).</p><p>In the original supplementary analyses, we showed resistance was independent of body dimension for both animals and plants, with the slopes of these correlations showing no clear trend. This pattern holds for the updated version of the plot but with the resistance axis reversed (Figure S2b,e).</p><p>In Figure S3 of the original supplementary materials, we showed that resistance did not have any clear association with the Raunkiær life forms. The updated version shows the same patterns, but with the resistance axes reversed (Figure S3, middle panel).</p><p>In Figure S4 of the original supplementary materials, we showed that there was a high variation in the compensation, resistance and recovery time among the different conservation statuses of the species (Figure S4). These results remain unaltered, but the resistance axes are reversed (Figure S4, middle panels).</p>\",\"PeriodicalId\":161,\"journal\":{\"name\":\"Ecology Letters\",\"volume\":\"27 7\",\"pages\":\"\"},\"PeriodicalIF\":7.7000,\"publicationDate\":\"2024-07-22\",\"publicationTypes\":\"Journal Article\",\"fieldsOfStudy\":null,\"isOpenAccess\":false,\"openAccessPdf\":\"https://onlinelibrary.wiley.com/doi/epdf/10.1111/ele.14468\",\"citationCount\":\"0\",\"resultStr\":null,\"platform\":\"Semanticscholar\",\"paperid\":null,\"PeriodicalName\":\"Ecology Letters\",\"FirstCategoryId\":\"93\",\"ListUrlMain\":\"https://onlinelibrary.wiley.com/doi/10.1111/ele.14468\",\"RegionNum\":1,\"RegionCategory\":\"环境科学与生态学\",\"ArticlePicture\":[],\"TitleCN\":null,\"AbstractTextCN\":null,\"PMCID\":null,\"EPubDate\":\"\",\"PubModel\":\"\",\"JCR\":\"Q1\",\"JCRName\":\"ECOLOGY\",\"Score\":null,\"Total\":0}","platform":"Semanticscholar","paperid":null,"PeriodicalName":"Ecology Letters","FirstCategoryId":"93","ListUrlMain":"https://onlinelibrary.wiley.com/doi/10.1111/ele.14468","RegionNum":1,"RegionCategory":"环境科学与生态学","ArticlePicture":[],"TitleCN":null,"AbstractTextCN":null,"PMCID":null,"EPubDate":"","PubModel":"","JCR":"Q1","JCRName":"ECOLOGY","Score":null,"Total":0}
引用次数: 0
摘要
Capdevila P, Stott I, Cant J, Beger M, Rowlands G, Grace M, Salguero-Gómez R. (2022) Life history mediates the trade-offs among different components of demographic resilience.Ecology Letters, 25(6), 1566-1579. https://doi.org/10.1111/ele.14004The 作者指出,方法部分的抗性计算有误,改变了一些结果的解释。在手稿中,我们对公式(3)中的阻力计算(ρ _ 1 $$ {\underset\{_}{rho}}_1 $$)进行了修正,从 1 中减去了第一步衰减(1 - ρ _ 1 $$ {\underset\{_}{rho}}_1 $$)。公式中的这种减法是错误的,正确的计算应该是 ρ _ 1 $$ {\underset\{_}{\rho}}_1 $$,其中接近 1 的值对应于高抗性,0 对应于低抗性。在原稿的图 2 中,我们表明抗性的系统发生信号在动物中为 0.48 ± 0.26(平均值 ± SE),在植物中为 0.02 ± 0.04。在原稿的图 3 中,我们发现抗性和恢复时间在动物中呈正相关,而在植物中呈轻微的负相关。此外,动物和植物的抗性和补偿也呈正相关。当采用正确的抗性计算方法时,同样的相关性依然存在,只是相关值倒置了。也就是说,抗性与恢复时间在动物中呈负相关(图 3a),在植物中呈正相关(图 3d),而抗性与补偿在动物(图 3d)和植物(图 3e)中均呈负相关。我们还表明,在植物和动物中,抗性与生殖产量呈正相关。在采用正确的抗性计算方法时,我们再次发现这些关联是成立的,但自然地,它们是相反的(图 4)。动物的抗逆性与世代时间呈正相关,而植物的抗逆性与世代时间呈负相关(图 4b),植物和动物的抗逆性与生殖产量呈负相关(图 4e)。当采用正确的抗逆性计算方法时,模拟种群与自然种群在抗逆性与生命史特征的关联方面仍然存在差异。在最初的补充分析中,我们发现动物和植物的抗逆性与身体尺寸无关,这些相关性的斜率没有明显的趋势。在原始补充材料的图 S3 中,我们发现抗性与 Raunkiær 生命形式没有任何明显的关联。在原始补充材料的图 S4 中,我们发现不同保护状态的物种在补偿、抵抗力和恢复时间方面存在很大差异(图 S4)。这些结果保持不变,但阻力轴发生了逆转(图 S4,中间面板)。
Correction to ‘Life history mediates the trade-offs among different components of demographic resilience’
Capdevila P, Stott I, Cant J, Beger M, Rowlands G, Grace M, Salguero-Gómez R. (2022) Life history mediates the trade-offs among different components of demographic resilience. Ecology Letters, 25(6), 1566–1579. https://doi.org/10.1111/ele.14004
The authors note a mistake in the calculation of resistance in the methods section, which alters the interpretation of some of the results. In the manuscript, we applied a correction to calculation of resistance () in Equation (3) by subtracting the first step attenuation from 1 (1 − ). Such subtraction in the formula was an error, and the correct calculation should simply be where values close to 1 correspond to high resistance and 0 to low resistance.
In Figure 2 of the original manuscript, we showed that the phylogenetic signal for resistance was 0.48 ± 0.26 (mean ± SE) in animals and 0.02 ± 0.04 in plants. When applying the correct calculation of resistance the phylogenetic signal remains virtually unaltered, with values of 0.45 ± 0.25 and 0.03 ± 0.04, respectively.
In Figure 3 of the original manuscript, we showed that resistance and recovery time were positively associated in animals and slightly, negatively associated in plants. Also, resistance and compensation were positively associated in animals and plants. When applying the correct calculation of resistance, the same associations hold, but the correlation values are inverted. That is, resistance and recovery time are negatively correlated in animals (Figure 3a) and positively correlated in plants (Figure 3d), while resistance and compensation are negatively correlated for both animals (Figure 3d) and plants (Figure 3e).
In Figure 4 of the original version of our paper, we showed that resistance was negatively associated with generation time in animals, while it was positively associated in plants. We also showed that resistance was positively associated with reproductive output for both plants and animals. When applying the correct calculation of resistance, we again show that the associations hold, but naturally they are reversed (Figure 4). Resistance is positively associated with generation time in animals and negatively associated in plants (Figure 4b), and resistance is negatively associated with reproductive output in both plants and animals (Figure 4e).
In the original supplementary analyses, we showed that most of the correlations among the life history traits and the resilience components were not spurious. When applying the correct calculation of resistance, there are still discrepancies between the simulated and the natural populations in their association of resistance with life history traits. The only difference is that the relationships with resistance are inverted (Figure S1).
In the original supplementary analyses, we showed resistance was independent of body dimension for both animals and plants, with the slopes of these correlations showing no clear trend. This pattern holds for the updated version of the plot but with the resistance axis reversed (Figure S2b,e).
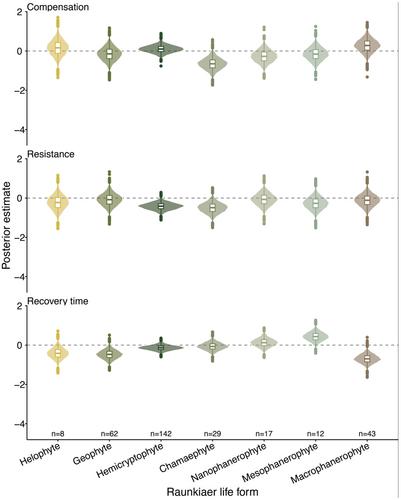
In Figure S3 of the original supplementary materials, we showed that resistance did not have any clear association with the Raunkiær life forms. The updated version shows the same patterns, but with the resistance axes reversed (Figure S3, middle panel).
In Figure S4 of the original supplementary materials, we showed that there was a high variation in the compensation, resistance and recovery time among the different conservation statuses of the species (Figure S4). These results remain unaltered, but the resistance axes are reversed (Figure S4, middle panels).
期刊介绍:
Ecology Letters serves as a platform for the rapid publication of innovative research in ecology. It considers manuscripts across all taxa, biomes, and geographic regions, prioritizing papers that investigate clearly stated hypotheses. The journal publishes concise papers of high originality and general interest, contributing to new developments in ecology. Purely descriptive papers and those that only confirm or extend previous results are discouraged.


 分享
分享
 求助内容:
求助内容: 应助结果提醒方式:
 扫码关注我们
