Theodoros V. Giannouchos PhD, MS, MPharm, Ronald G. Pirrallo MD, MHSA, Brad Wright PhD
{"title":"急诊科的频繁使用是其他医疗服务的补充或替代吗?来自南卡罗来纳州医疗补助计划参保者的证据。","authors":"Theodoros V. Giannouchos PhD, MS, MPharm, Ronald G. Pirrallo MD, MHSA, Brad Wright PhD","doi":"10.1111/1475-6773.14430","DOIUrl":null,"url":null,"abstract":"<div>\n \n \n <section>\n \n <h3> Objective</h3>\n \n <p>To compare healthcare services utilization across the healthcare system between frequent and non-frequent emergency department (ED) users among Medicaid enrollees in South Carolina.</p>\n </section>\n \n <section>\n \n <h3> Study Setting and Design</h3>\n \n <p>We conducted a retrospective, longitudinal study of individuals with at least one ED visit in 2017 in South Carolina and identified their healthcare services visits over 730 days (2 years) after their first ED visit. We classified individuals based on intensity of ED use: superfrequent (≥9 ED visits/year), frequent (4–8 ED visits/year), and non-frequent ED users (≤3 visits/year). We estimated differences between the three groups of ED users and non-ED hospital and office-based visits using multivariable two-part regression models.</p>\n </section>\n \n <section>\n \n <h3> Data Sources and Analytic Sample</h3>\n \n <p>We used statewide Medicaid claims from January 2017 to December 2019 for ED users aged 18–64 years with continuous Medicaid enrollment. We analyzed data on all frequent and superfrequent users and selected a 4:1 random sample among all non-frequent users (~half of all non-frequent users).</p>\n </section>\n \n <section>\n \n <h3> Principal Findings</h3>\n \n <p>The study included 52,845 ED users, of whom 42,764 were non-frequent, 7677 frequent, and 2404 superfrequent users. Within 2 years from the date of their first ED visit, superfrequent ED users averaged 38.3 ED visits, frequent ED users 10.9 ED visits, and non-frequent ED users 2.6 ED visits (<i>p</i> < 0.001). Compared with non-frequent users, frequent and superfrequent ED users had more comorbidities and chronic conditions on average (1.6 vs. 3.5 vs. 6.4, <i>p</i> < 0.001). Both frequent and superfrequent users had more hospital visits beyond the ED overall (marginal effects: 0.23, 95% CI 0.18–0.27; 0.40, 95% CI 0.29–0.50), and more outpatient office visits overall (marginal effects: 4.39, 95% CI 2.52–6.27; 9.23, 95% CI 5.66–12.81), including primary care and most specialists' visits, compared with non-frequent users.</p>\n </section>\n \n <section>\n \n <h3> Conclusions</h3>\n \n <p>Frequent ED users utilized non-ED hospital and outpatient office-based healthcare services significantly more than non-frequent ED users. These findings can guide tailored interventions using data across the healthcare system to efficiently coordinate care, contain costs, and improve health outcomes for these individuals.</p>\n </section>\n </div>","PeriodicalId":55065,"journal":{"name":"Health Services Research","volume":"60 3","pages":""},"PeriodicalIF":3.0000,"publicationDate":"2025-01-02","publicationTypes":"Journal Article","fieldsOfStudy":null,"isOpenAccess":false,"openAccessPdf":"https://onlinelibrary.wiley.com/doi/epdf/10.1111/1475-6773.14430","citationCount":"0","resultStr":"{\"title\":\"Is frequent emergency department use a complement or substitute for other healthcare services? Evidence from South Carolina Medicaid enrollees\",\"authors\":\"Theodoros V. Giannouchos PhD, MS, MPharm, Ronald G. Pirrallo MD, MHSA, Brad Wright PhD\",\"doi\":\"10.1111/1475-6773.14430\",\"DOIUrl\":null,\"url\":null,\"abstract\":\"<div>\\n \\n \\n <section>\\n \\n <h3> Objective</h3>\\n \\n <p>To compare healthcare services utilization across the healthcare system between frequent and non-frequent emergency department (ED) users among Medicaid enrollees in South Carolina.</p>\\n </section>\\n \\n <section>\\n \\n <h3> Study Setting and Design</h3>\\n \\n <p>We conducted a retrospective, longitudinal study of individuals with at least one ED visit in 2017 in South Carolina and identified their healthcare services visits over 730 days (2 years) after their first ED visit. We classified individuals based on intensity of ED use: superfrequent (≥9 ED visits/year), frequent (4–8 ED visits/year), and non-frequent ED users (≤3 visits/year). We estimated differences between the three groups of ED users and non-ED hospital and office-based visits using multivariable two-part regression models.</p>\\n </section>\\n \\n <section>\\n \\n <h3> Data Sources and Analytic Sample</h3>\\n \\n <p>We used statewide Medicaid claims from January 2017 to December 2019 for ED users aged 18–64 years with continuous Medicaid enrollment. We analyzed data on all frequent and superfrequent users and selected a 4:1 random sample among all non-frequent users (~half of all non-frequent users).</p>\\n </section>\\n \\n <section>\\n \\n <h3> Principal Findings</h3>\\n \\n <p>The study included 52,845 ED users, of whom 42,764 were non-frequent, 7677 frequent, and 2404 superfrequent users. Within 2 years from the date of their first ED visit, superfrequent ED users averaged 38.3 ED visits, frequent ED users 10.9 ED visits, and non-frequent ED users 2.6 ED visits (<i>p</i> < 0.001). Compared with non-frequent users, frequent and superfrequent ED users had more comorbidities and chronic conditions on average (1.6 vs. 3.5 vs. 6.4, <i>p</i> < 0.001). Both frequent and superfrequent users had more hospital visits beyond the ED overall (marginal effects: 0.23, 95% CI 0.18–0.27; 0.40, 95% CI 0.29–0.50), and more outpatient office visits overall (marginal effects: 4.39, 95% CI 2.52–6.27; 9.23, 95% CI 5.66–12.81), including primary care and most specialists' visits, compared with non-frequent users.</p>\\n </section>\\n \\n <section>\\n \\n <h3> Conclusions</h3>\\n \\n <p>Frequent ED users utilized non-ED hospital and outpatient office-based healthcare services significantly more than non-frequent ED users. These findings can guide tailored interventions using data across the healthcare system to efficiently coordinate care, contain costs, and improve health outcomes for these individuals.</p>\\n </section>\\n </div>\",\"PeriodicalId\":55065,\"journal\":{\"name\":\"Health Services Research\",\"volume\":\"60 3\",\"pages\":\"\"},\"PeriodicalIF\":3.0000,\"publicationDate\":\"2025-01-02\",\"publicationTypes\":\"Journal Article\",\"fieldsOfStudy\":null,\"isOpenAccess\":false,\"openAccessPdf\":\"https://onlinelibrary.wiley.com/doi/epdf/10.1111/1475-6773.14430\",\"citationCount\":\"0\",\"resultStr\":null,\"platform\":\"Semanticscholar\",\"paperid\":null,\"PeriodicalName\":\"Health Services Research\",\"FirstCategoryId\":\"3\",\"ListUrlMain\":\"https://onlinelibrary.wiley.com/doi/10.1111/1475-6773.14430\",\"RegionNum\":2,\"RegionCategory\":\"医学\",\"ArticlePicture\":[],\"TitleCN\":null,\"AbstractTextCN\":null,\"PMCID\":null,\"EPubDate\":\"\",\"PubModel\":\"\",\"JCR\":\"Q2\",\"JCRName\":\"HEALTH CARE SCIENCES & SERVICES\",\"Score\":null,\"Total\":0}","platform":"Semanticscholar","paperid":null,"PeriodicalName":"Health Services Research","FirstCategoryId":"3","ListUrlMain":"https://onlinelibrary.wiley.com/doi/10.1111/1475-6773.14430","RegionNum":2,"RegionCategory":"医学","ArticlePicture":[],"TitleCN":null,"AbstractTextCN":null,"PMCID":null,"EPubDate":"","PubModel":"","JCR":"Q2","JCRName":"HEALTH CARE SCIENCES & SERVICES","Score":null,"Total":0}
Is frequent emergency department use a complement or substitute for other healthcare services? Evidence from South Carolina Medicaid enrollees
Objective
To compare healthcare services utilization across the healthcare system between frequent and non-frequent emergency department (ED) users among Medicaid enrollees in South Carolina.
Study Setting and Design
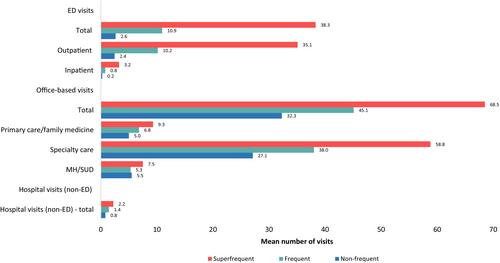
We conducted a retrospective, longitudinal study of individuals with at least one ED visit in 2017 in South Carolina and identified their healthcare services visits over 730 days (2 years) after their first ED visit. We classified individuals based on intensity of ED use: superfrequent (≥9 ED visits/year), frequent (4–8 ED visits/year), and non-frequent ED users (≤3 visits/year). We estimated differences between the three groups of ED users and non-ED hospital and office-based visits using multivariable two-part regression models.
Data Sources and Analytic Sample
We used statewide Medicaid claims from January 2017 to December 2019 for ED users aged 18–64 years with continuous Medicaid enrollment. We analyzed data on all frequent and superfrequent users and selected a 4:1 random sample among all non-frequent users (~half of all non-frequent users).
Principal Findings
The study included 52,845 ED users, of whom 42,764 were non-frequent, 7677 frequent, and 2404 superfrequent users. Within 2 years from the date of their first ED visit, superfrequent ED users averaged 38.3 ED visits, frequent ED users 10.9 ED visits, and non-frequent ED users 2.6 ED visits (p < 0.001). Compared with non-frequent users, frequent and superfrequent ED users had more comorbidities and chronic conditions on average (1.6 vs. 3.5 vs. 6.4, p < 0.001). Both frequent and superfrequent users had more hospital visits beyond the ED overall (marginal effects: 0.23, 95% CI 0.18–0.27; 0.40, 95% CI 0.29–0.50), and more outpatient office visits overall (marginal effects: 4.39, 95% CI 2.52–6.27; 9.23, 95% CI 5.66–12.81), including primary care and most specialists' visits, compared with non-frequent users.
Conclusions
Frequent ED users utilized non-ED hospital and outpatient office-based healthcare services significantly more than non-frequent ED users. These findings can guide tailored interventions using data across the healthcare system to efficiently coordinate care, contain costs, and improve health outcomes for these individuals.
期刊介绍:
Health Services Research (HSR) is a peer-reviewed scholarly journal that provides researchers and public and private policymakers with the latest research findings, methods, and concepts related to the financing, organization, delivery, evaluation, and outcomes of health services. Rated as one of the top journals in the fields of health policy and services and health care administration, HSR publishes outstanding articles reporting the findings of original investigations that expand knowledge and understanding of the wide-ranging field of health care and that will help to improve the health of individuals and communities.


 分享
分享
 求助内容:
求助内容: 应助结果提醒方式:
 扫码关注我们
